MGM stock forecast 2027–2029
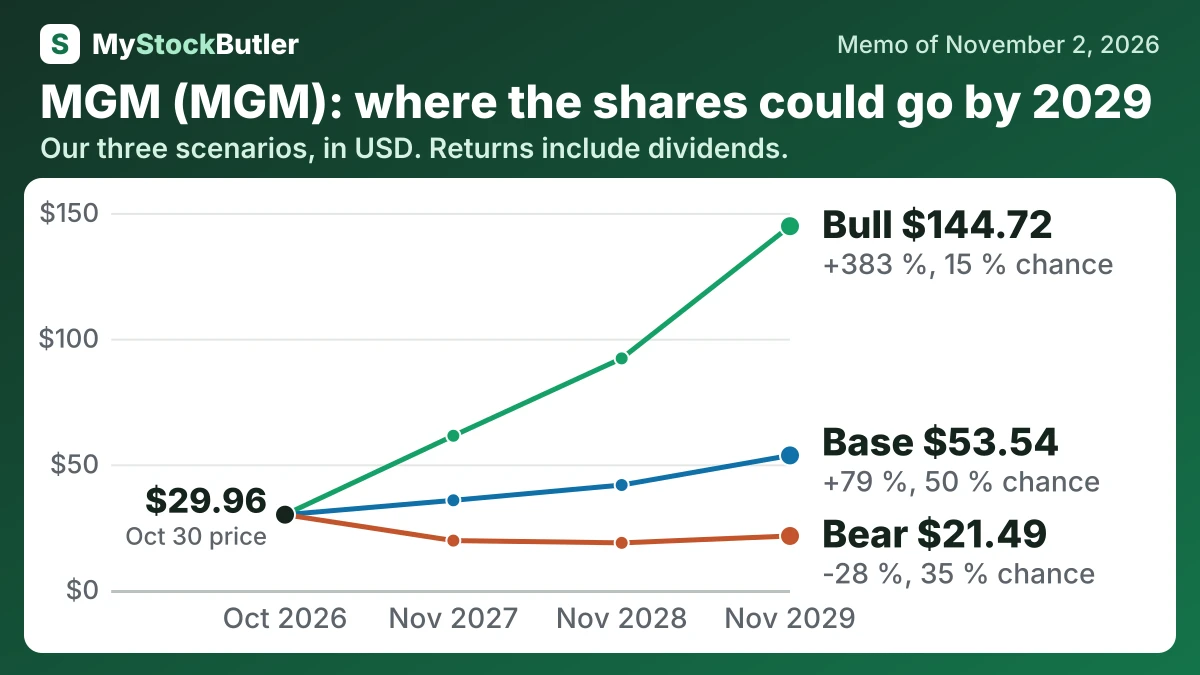
MyStockButler's November 2026 analysis: The weighted scenario is $33.92 in November 2027, with 35% bear, 50% base and 15% bull. It hinges on Las Vegas room rates and margins.
Where could MGM's shares be by 2029?
The forecast’s weighted outcome is positive, but the range reflects MGM’s operating and financial leverage. In the first year, the weighted price is $33.92, a 13% total return. In the second year, it is $41.26, a 38% return. In the third year, it is $56.00, an 87% return. The third-year bear-to-bull range is $21.49 to $144.72, against today’s $29.96.
The probabilities are 35% bear, 50% base and 15% bull. The table shows how those paths produce the weighted prices.
| Case | Probability | November 2027 | November 2028 | November 2029 |
|---|---|---|---|---|
| Bear | 35 % | 19.65 (-34 %) | 18.75 (-37 %) | 21.49 (-28 %) |
| Base | 50 % | 35.68 (+19 %) | 41.76 (+39 %) | 53.54 (+79 %) |
| Bull | 15 % | 61.36 (+105 %) | 92.13 (+208 %) | 144.72 (+383 %) |
| Weighted | 100 % | 33.92 (+13 %) | 41.26 (+38 %) | 56.00 (+87 %) |
What this means. The weighted row is the probability-based estimate across the bear, base, and bull cases, so it is not simply the average of the three prices.
What has to go right or wrong for MGM's forecast?
The bear case assumes Las Vegas room pricing stays weak, Macau play softens and BetMGM grows more slowly. Osaka keeps absorbing capital before opening, so weaker cash flow limits buybacks and reinforces the valuation discount. It leads to $19.65 in the first year and $21.49 in the third, with 35% probability. The probability exceeds the operating specialists’ 30% because ADR and Strip EBITDAR are already falling, while MGM Digital remains loss-making.
The bull case requires conventions and leisure demand to restore room rates, Macau volumes to improve and BetMGM to sustain profitable growth. MGM must also fund Osaka and maintain heavy buybacks without straining liquidity. It leads to $61.36 in the first year and $144.72 in the third, with 15% probability. The upside is large, but several favorable outcomes must align while the latest quarter still showed pricing and Strip-profit pressure.
How much cash does MGM really make?
In 2025, operations generated $2.53 billion. Capital spending was $1.07 billion, leaving $1.46 billion of free cash flow. This measure starts with cash from the business and subtracts spending on long-lived assets such as rooms, equipment and technology.
| 2025 | 2024 | 2023 | 2022 | 2021 | |
|---|---|---|---|---|---|
| Cash from operations | 2,529,378 | 2,362,495 | 2,690,777 | 1,756,462 | 1,373,423 |
| − Capital spending | 1,068,927 | 1,150,589 | 931,813 | 765,067 | 490,697 |
| = Free cash flow | 1,460,451 | 1,211,906 | 1,758,964 | 991,395 | 882,726 |
| − Stock pay | 90,471 | 80,224 | 73,607 | 71,296 | 65,183 |
| = Real free cash flow | 1,369,980 | 1,131,682 | 1,685,357 | 920,099 | 817,543 |
| Real free cash flow, % of revenue | 7.8% | 6.6% | 10.4% | 7.0% | 8.4% |
What this means. Real free cash flow is lower because shares given to employees cost no cash today but reduce existing shareholders’ ownership.
What does MGM's stock price today imply?
| Today (Nov 2, 2026) | |
|---|---|
| Share price | 29.96 |
| Market value (calculated) | 7,580,195.99 |
| Enterprise value (calculated) | 10,873,381.99 |
| P/E, last 12 months (calculated) | 11.4x |
| P/E, next 12 months (calculated) | 19.1x |
| Real free cash flow yield (calculated) | 18.1% |
What this means. The next 12 months price-to-earnings ratio uses analysts’ expected profit, so it can change and is not based on money the company has already earned.