Lennox earnings date and guidance
MyStockButler's October 2026 analysis: Lennox's next results are expected on October 28, 2026. Watch whether acquired growth and inventory reduction produce cash before debt maturities.
What has Lennox guided for 2026?
The July 29, 2026 update cut adjusted earnings per share guidance to $23.00–$24.00 from $23.50–$25.00. It kept 2026 revenue growth at 8.0%, with acquisitions expected to supply 5.0 percentage points.
The unchanged annual free-cash-flow target is $750–$850 million. Free cash flow is operating cash left after capital spending. Lennox can release cash by selling equipment already in inventory without immediately replacing it, but cutting stock too far can leave contractors without the right unit and send them to a competitor.
| The period guided | Low | High | The date it was given | |
|---|---|---|---|---|
| Total LII — Revenue Δ YoY | Year to Dec 2026 | 8.0% | 8.0% | Jul 29, 2026 |
| HCS — Revenue Δ YoY | Year to Dec 2026 | 1.0% | 1.0% | Jul 29, 2026 |
| BCS — Revenue Δ YoY | Year to Dec 2026 | 20.0% | 20.0% | Jul 29, 2026 |
| Adjusted EPS | Year to Dec 2026 | 23.00 | 24.00 | Jul 29, 2026 |
| Free Cash Flow | Year to Dec 2026 | 750 | 850 | Jul 29, 2026 |
What this means. The negative productivity figure is good news: it means the company expects to save about 60 million United States dollars by becoming more efficient.
Has Lennox kept its past promises?
Maskara promised an 18–20% operating margin for 2026 in December 2022, and Lennox reached 20.0% in 2025. That is meaningful delivery on profitability. But expectations that residential recovery would arrive in 2026 shifted toward stronger benefits in 2027. The record is therefore mixed: management improved profitability, while the recovery took longer than expected. The rows below show how pay, related cash flows, buybacks and share counts compare from 2021 through 2025.
| What management forecast | Checked | Above | Within | Below |
|---|---|---|---|---|
| Revenue growth / Core revenue growth | 5 years | 4 | 0 | 1 |
| Adjusted EPS from continuing operations / Adjusted earnings per share | 5 years | 3 | 2 | 0 |
| Free cash flow | 5 years | 3 | 0 | 2 |
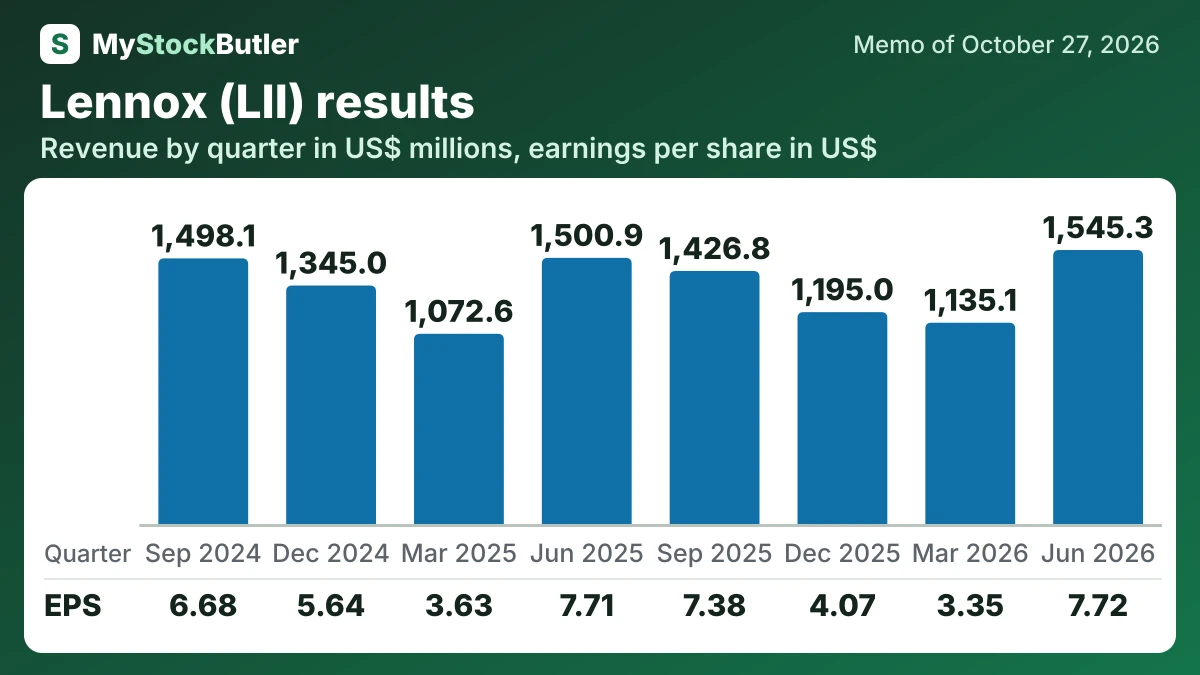
What do Lennox's last eight quarters show?
Net income fell from $273.9 million to $269.0 million. EPS barely changed, from $7.71 to $7.72. Cash was more encouraging: operating cash rose from $86.8 million to $172.0 million, while free cash flow rose from $58.3 million to $136.3 million. Lower inventory helped, but seasonal comparisons remain important.
| Jun 2026 | Mar 2026 | Dec 2025 | Sep 2025 | Jun 2025 | Mar 2025 | Dec 2024 | Sep 2024 | |
|---|---|---|---|---|---|---|---|---|
| Revenue | 1,545.3 | 1,135.1 | 1,195.0 | 1,426.8 | 1,500.9 | 1,072.6 | 1,345.0 | 1,498.1 |
| Gross margin | 34.9% | 30.9% | 32.6% | 34.1% | 34.5% | 31.8% | 34.3% | 32.6% |
| Operating income | 355.0 | 163.5 | 195.8 | 328.8 | 349.0 | 168.0 | 250.2 | 303.3 |
| Net income | 269.0 | 117.2 | 142.5 | 259.9 | 273.9 | 129.6 | 201.9 | 239.0 |
| EPS, diluted | 7.72 | 3.35 | 4.07 | 7.38 | 7.71 | 3.63 | 5.64 | 6.68 |
| = Free cash flow | 136.3 | -39.4 | 376.7 | 265.1 | 58.3 | -61.3 | 272.2 | 410.9 |
What this means. The profit numbers are not perfectly comparable because the company changed how it counts inventory and corrected earlier errors, so some changes may reflect accounting changes rather than business performance.
What should I watch in Lennox's next results?
The first test is October 28, 2026, when Lennox reports Q3 results and holds its earnings call. Heat Controller closed on July 13, so Q3 will be the first quarter to include its financial results. Its Comfort-Aire and Century brands are expected to add 1.0 percentage point to annual company growth and 2.0 points to HCS growth.