Lennox dividend: payment and cash coverage
MyStockButler's October 2026 analysis: Lennox pays $5.44 per share annually, and its 2025 free cash flow was $638.8 million. After stock pay, real free cash flow was $609.7 million, providing cash to compare with dividends and buybacks.
How much does Lennox pay shareholders over time?
Dividends begin from the $5.44 annualized run rate. The base case reaches $6.48 per share by 2029; the bear holds at $5.44, while the bull reaches $7.04. The base reflects a long record of annual increases, but moderate raises leave room for debt reduction. Management gives no dividend target and expects $750–$850 million of 2026 free cash flow.
| 2025 | 2024 | 2023 | 2022 | 2021 | |
|---|---|---|---|---|---|
| EPS, diluted | 22.79 | 22.66 | 16.58 | 13.88 | 12.39 |
| Free cash flow per share | 18.05 | 21.85 | 13.61 | 5.62 | 10.90 |
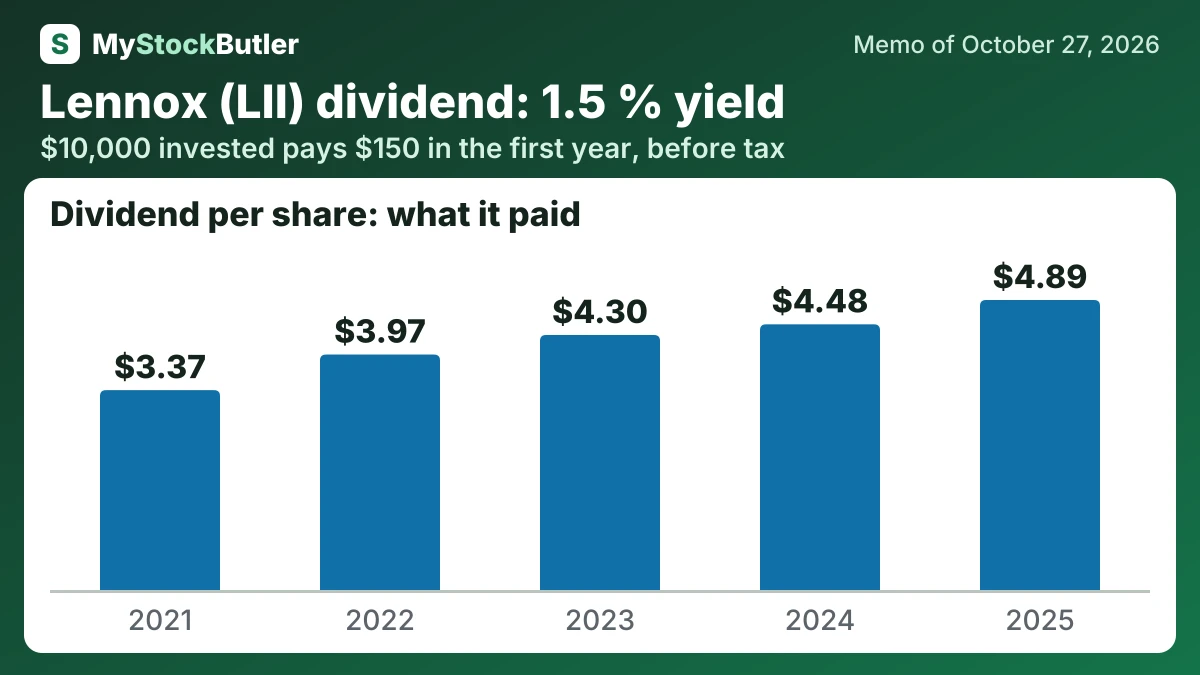
| − Dividends paid, per share | 4.89 | 4.48 | 4.30 | 3.97 | 3.37 |
| − Share buybacks, per share | 13.62 | 1.50 | 0.00 | 8.38 | 16.00 |
| = FCF not paid out, per share | 15.87 | 9.32 |
What this means. The company's own free cash flow per share is higher because it does not subtract shares given to employees as pay; we subtract them because they reduce each existing shareholder's portion.
How much would Lennox's dividend pay you?
$10,000 invested in Lennox at its 1.5% dividend yield (our report of October 27, 2026) pays $150.00 in the first year, before tax. If its dividend per share keeps changing 9.8% a year, as it did from 2021 to 2025, and the dividends are reinvested, year 10 pays $423.06, with $2,627.89 received in all.
Before tax. Past dividend growth is not a promise. Information only, not investment advice.
Is Lennox's dividend covered by its cash?
Lennox’s own free-cash-flow measure was $640.2 million. Deducting $29.1 million of stock compensation from $638.8 million of operating cash flow less capital spending produces an analytical “real free cash flow” of $609.7 million, reflecting dilution rather than a cash payment. Capital spending also fell from $250.2 million in 2023 to $118.8 million in 2025, so the lower requirement may not be permanent.
| 2025 | 2024 | 2023 | 2022 | 2021 | |
|---|---|---|---|---|---|
| Free cash flow | 638.8 | 782.1 | 486.0 | 201.2 | 408.7 |
| − Dividends paid | 173.0 | 160.3 | 153.4 | 142.0 | 126.5 |
| − Share buybacks | 482.3 | 53.6 | 0 | 300.0 | 600.0 |
| = Free cash flow not paid out | 568.2 | 332.6 | |||
| Paid out, % of free cash flow | 102.6% | 27.3% | 31.6% | 219.7% | 177.8% |
What this means. The company paid out more than its free cash flow in 2025, 2022, and 2021, so it had to use savings or borrow money to pay shareholders.
What could change Lennox's dividend?
The outcome turns on residential sell-through—the pace at which equipment leaves the channel for end customers—acquired parts growth, profitable commercial orders and factory utilization. Q3 results arrive October 28, 2026, with Heat Controller, the acquired HVAC equipment and parts business, included for the first time. By December 31, 2026, inventory must fall while cash generation and commercial availability hold up. In 2027–2028, those drivers must support cash before debt maturities in August and October 2027 and $500 million due in 2028.
What is Lennox's dividend yield today against its price?
A dividend yield answers how much income the share price buys; it does not show whether equipment is moving through dealers or whether profit becomes cash. Buybacks can return more money, but only if Lennox buys shares at sensible prices and does not weaken the balance sheet.
| Today (Oct 27, 2026) | |
|---|---|
| Share price | 372.05 |
| P/E, last 12 months (calculated) | 16.5x |
| Free cash flow yield (calculated) | 5.0% |
| Real free cash flow yield (calculated) | 4.7% |
| Dividend yield (calculated) | 1.5% |
What this means. Enterprise value is higher than market value because it includes the company's debt after subtracting its cash, showing the broader cost of buying the whole business.