Kimco Realty dividend history
MyStockButler's October 2026 analysis: Kimco Realty paid $1.01 per share in 2025, and its $1.26 FAD per share covered the dividend. Operating cash covered Kimco Realty's dividends in each of the five years.
How much does Kimco Realty pay in dividends?
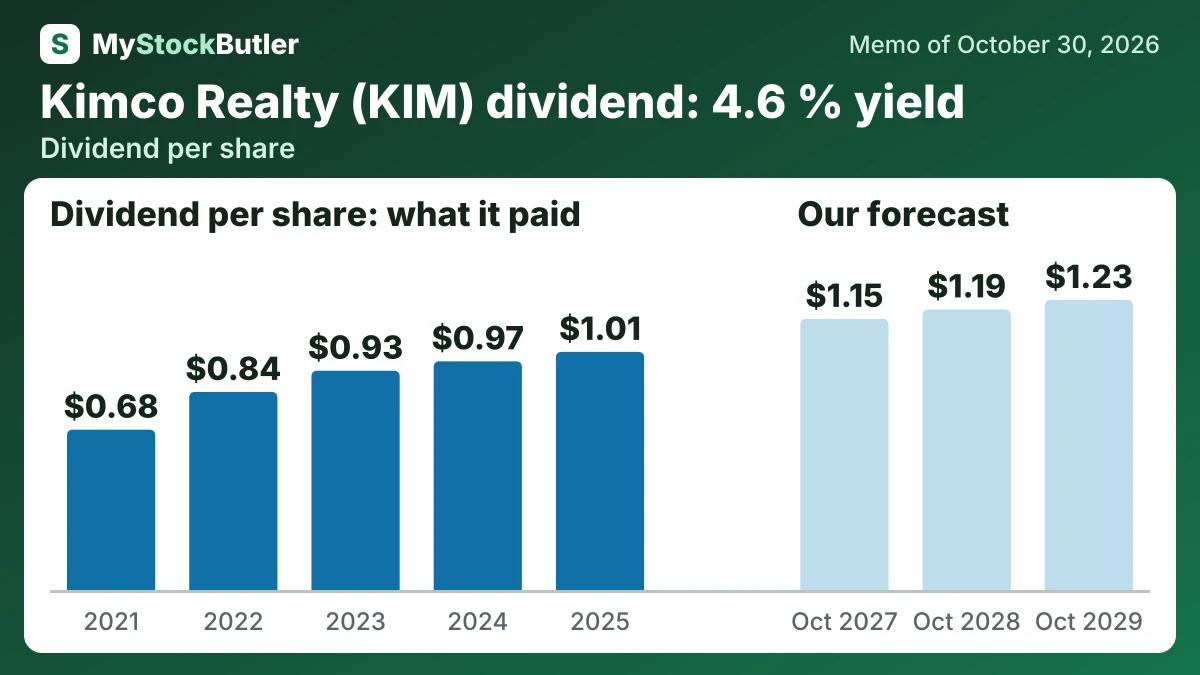
Those deductions reflect the economics of leasing. When a tenant leaves, Kimco may have to refit the space and pay a broker before the replacement tenant begins paying rent. In 2025, FAD was $1.26 per share against a $1.01 dividend per share. The stated payout ratio was 80.2%, leaving a cushion but not unlimited flexibility.
The base dividend rises from $1.15 per share in 2027 to $1.23 in 2029. The bear path moves from $1.12 to $0.98, while the bull path moves from $1.18 to $1.32. The base assumes gradual increases because the quarterly dividend was $0.28 in September 2026 and 2025 FAD covered the $1.01 dividend, but the payout already used 80.2% of FAD.
| 2025 | 2024 | 2023 | 2022 | 2021 | |
|---|---|---|---|---|---|
| AFFO per share (company's measure) | 1.26 | 1.21 | 1.18 | 1.21 | 1.17 |
| Dividend per share | 1.01 | 0.97 | 0.93 | 0.84 | 0.68 |
| AFFO payout ratio | 80.2% | 80.2% | 78.8% | 69.4% | 58.1% |
What this means. The same-store profit growth percentages are not perfectly comparable because the company changed which properties and redevelopment projects it includes.
Does Kimco Realty's dividend come from cash?
Operating cash covered Kimco’s dividends in each of the five years, but it did not fund every investment and financing decision by itself. Kimco also spent on development, acquisitions and property improvements, while using property sales, new debt and changes in equity to manage the wider plan.
Cash flow shows why the cushion must be read carefully. Operating activities generated $977.8 million during the first nine months of 2026, compared with $861.6 million in the comparable period of 2025. Redevelopment and renovations consumed $179.6 million, up from $126.3 million.
| 2025 | 2024 | 2023 | 2022 | 2021 | |
|---|---|---|---|---|---|
| Cash from operations | 1,120,015 | 1,005,621 | 1,071,607 | 861,114 | 618,875 |
| − Dividends paid | 684,368 | 655,218 | 632,421 | 519,414 | 356,712 |
| = Operating cash after dividends | 435,647 | 350,403 | 439,186 | 341,700 | 262,163 |
| − Acquisitions | 218,377 | 152,943 | 277,308 | 300,772 | 355,953 |
| − Development and capital spending | 347,616 | 324,465 | 264,395 | 193,710 | 163,699 |
| − Shares bought back | 120,329 | 0 | 0 | 0 | 0 |
What this means. The acquisitions row shows only cash paid, so a merger paid for with shares can be much larger than the cash shown.
What could change Kimco Realty's dividend?
The first test is whether signed-but-not-open rent starts by October 2027. Broad commencement supports the base or bull cases; delays move the forecast toward bear.
| October 2027 | October 2028 | October 2029 | |
|---|---|---|---|
| Funds Available for Distribution (FAD) | 943 (853 / 970) | 981 (818 / 1,048) | 1,020 (794 / 1,132) |
| Shares (millions) | 663 (666 / 660) | 662 (667 / 656) | 660 (668 / 653) |
| Dividends per share | 1.15 (1.12 / 1.18) | 1.19 (1.06 / 1.25) | 1.23 (0.98 / 1.32) |
| Price to Funds Available for Distribution (FAD) | 18.00 (16.00 / 19.00) | 18.00 (14.00 / 20.00) | 18.00 (13.00 / 21.00) |