Kimco Realty earnings
MyStockButler's October 2026 analysis: Kimco Realty reported improving property operations in the third quarter of 2026, with revenue and NOI up year over year, FFO per share higher, and leased occupancy at 96.6%. The next release should show how much signed-but-not-open rent actually commenced.
What has Kimco Realty guided for 2026?
On October 29, management raised its full-year forecast for FFO to $1.84–$1.86 per diluted share and forecast same-property NOI growth of 3.5%–3.8%. FFO adjusts accounting profit to show recurring real-estate operations more clearly by adding back real-estate depreciation and removing property-sale gains. NOI measures income from the properties after their operating expenses, but before company costs and financing.
| Period guided | Low | High | Date given | |
|---|---|---|---|---|
| Net income available to the company's common shareholders per diluted share | Year to Dec 2026 | 1.07 | 1.09 | Oct 29, 2026 |
| FFO available to the company's common shareholders per diluted share | Year to Dec 2026 | 1.84 | 1.86 | Oct 29, 2026 |
| Same property NOI growth | Year to Dec 2026 | 3.5% | 3.8% | Oct 29, 2026 |
What this means. The property company's standard profit measure is different from net income because it adds back building wear-and-tear and removes gains from selling properties.
Has Kimco Realty kept its past promises?
Its “Promises kept” record is 4/5. Over four years, FFO guidance was exceeded three times and met once.
| What management forecast | Checked | Above | Within | Below |
|---|---|---|---|---|
| FFO per diluted share | 4 years | 3 | 1 | 0 |
| Net income available to common shareholders per diluted share | 4 years | 3 | 0 | 1 |
| Same Property NOI growth | 4 years | 2 | 2 | 0 |
What do Kimco Realty's last eight quarters show?
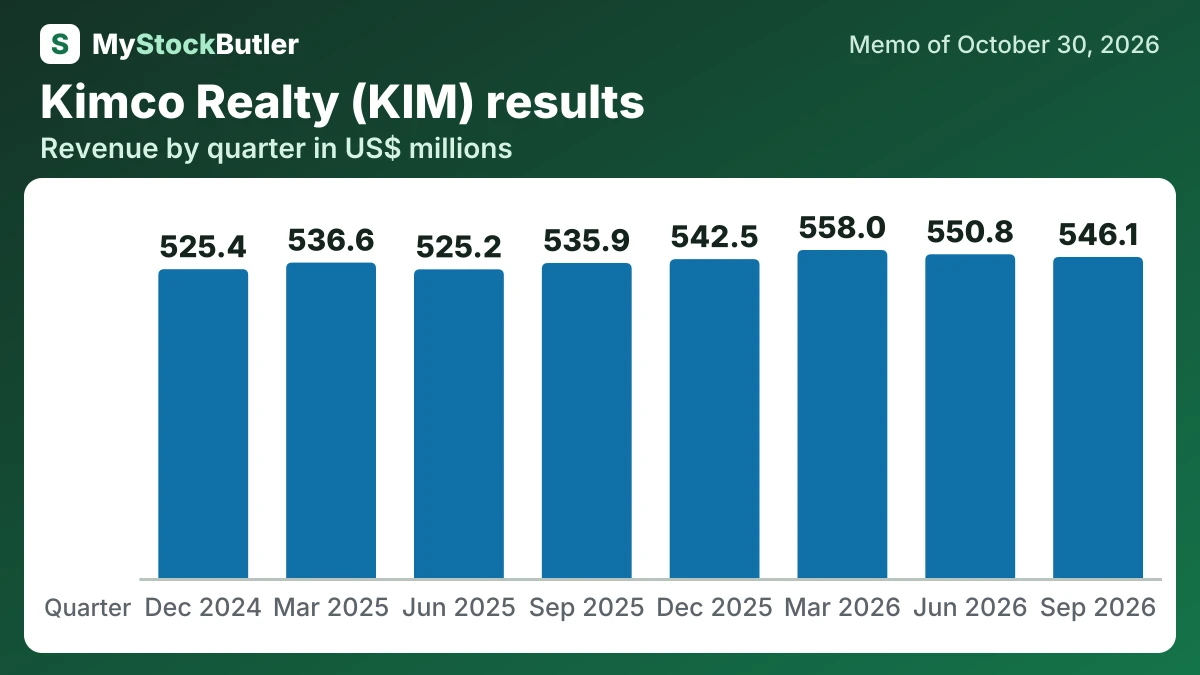
The third quarter of 2026 showed improving property operations, but asset sales made accounting earnings look stronger still. Revenue and NOI increased from a year earlier, FFO per share rose, and leased occupancy reached 96.6% versus 95.7%.
| Sep 2026 | Jun 2026 | Mar 2026 | Dec 2025 | Sep 2025 | Jun 2025 | Mar 2025 | Dec 2024 | |
|---|---|---|---|---|---|---|---|---|
| Revenue | 546,147 | 550,801 | 558,016 | 542,456 | 535,861 | 525,175 | 536,624 | 525,397 |
| FFO per share | 0.47 | 0.46 | 0.46 | 0.44 | 0.44 | 0.44 | 0.44 | 0.42 |
| AFFO per share (company's measure) | 0.35 | 0.32 | 0.39 | 0.27 | 0.31 | 0.31 | 0.37 | 0.27 |
| Dividend per share | 0.28 | 0.26 | 0.26 | 0.26 | 0.25 | 0.25 | 0.25 | 0.25 |
| Occupancy | 96.6% | 96.4% | 96.3% | 96.4% | 95.7% | 95.4% | 95.8% | 96.3% |
What this means. The occupancy percentage includes signed leases even when the tenant has not opened yet, so it can be higher than the space currently in use.
What should I watch in Kimco Realty's next release?
When Kimco reports fourth-quarter 2026 results, compare actual FFO and same-property NOI growth with the October ranges. Also separate profit from property sales from income produced by continuing operations, and check how much SNO rent actually commenced. That report should include Kimco’s first full 2027 guidance, creating a fresh comparison with the analyst estimate.