Kimco Realty stock forecast 2027–2029
MyStockButler's October 2026 analysis: Kimco Realty's weighted scenario is $24.90 in October 2027 and $26.63 in October 2029, with bear, base and bull probabilities of 22%, 60% and 18%. Kimco Realty's path hinges on whether signed-but-not-open rent commences by October 2027, then on refinancing costs, property cap rates and redevelopment yields.
Where could Kimco Realty's shares be by 2029?
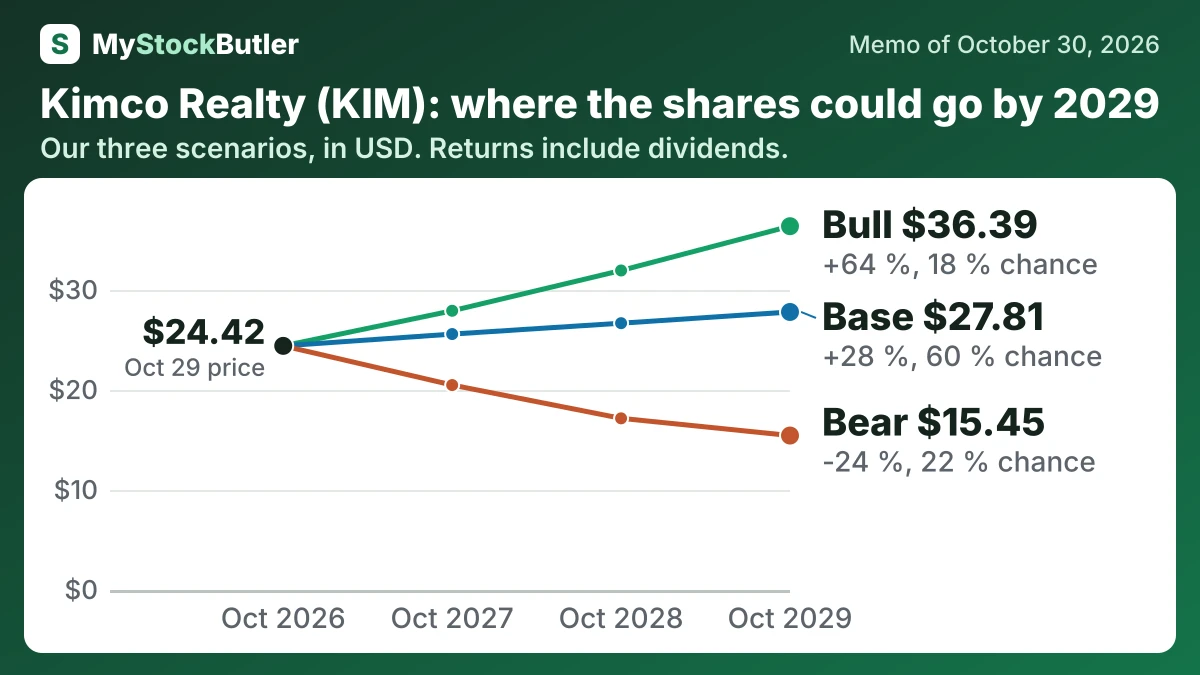
Our weighted share price is $24.90 in October 2027, implying a 7% total return. It reaches $26.63 in October 2029, implying a 23% total return. Bear, base and bull probabilities are 22%, 60% and 18%.
| Case | Probability | October 2027 | October 2028 | October 2029 |
|---|---|---|---|---|
| Bear | 22 % | 20.50 (-11 %) | 17.17 (-21 %) | 15.45 (-24 %) |
| Base | 60 % | 25.60 (+10 %) | 26.69 (+19 %) | 27.81 (+28 %) |
| Bull | 18 % | 27.93 (+19 %) | 31.96 (+41 %) | 36.39 (+64 %) |
| Weighted | 100 % | 24.90 (+7 %) | 25.55 (+14 %) | 26.63 (+23 %) |
What has to go right or wrong for Kimco Realty?
The bear case falls to $853 million in 2027 and $818 million in 2028, then $794 million in 2029. Delayed openings, higher leasing costs and refinancing pressure outweigh rent growth. The bull case reaches $970 million in 2027 and $1.048 billion in 2028, then $1.132 billion in 2029. It requires faster lease openings and successful redevelopment. Kimco had 96.6% of space leased, while signed-but-not-open leases represented $76 million of annual rent. Management expected about $64 million to commence through 2027.
How much cash does Kimco Realty really make?
As of March 23, 2026, Flynn beneficially held 1,475,674 shares, including exchangeable partnership interests. Cohen held 709,681. Kimco’s 2025 stock-based pay was $33.2 million. Diluted shares grew 0.4% that year to 681.901 million.
The dividend yield measures the cash Kimco distributes if the payout continues. A rough annualization of first-nine-month 2026 operating cash flow after property improvements produces a free-cash-flow yield of about 5.8%, but that is only a supporting check. Kimco’s buyback also offers a comparison: it sold The Witmer at about a 5.1% property cap rate while management estimated that repurchased shares implied a mid-7% cap rate. The measures differ, so the next question is how that valuation compares with Kimco’s own past.
| 2025 | 2024 | 2023 | 2022 | 2021 | |
|---|---|---|---|---|---|
| AFFO (company's measure) | 848,400 | 814,614 | 728,076 | 746,817 | 595,300 |
| AFFO per share (company's measure) | 1.26 | 1.21 | 1.18 | 1.21 | 1.17 |
| Dividends paid | 684,368 | 655,218 | 632,421 | 519,414 | 356,712 |
| AFFO payout ratio | 80.2% | 80.2% | 78.8% | 69.4% | 58.1% |
What this means. The rows called adjusted funds from operations use Kimco’s own Funds Available for Distribution definition, so they may not be comparable with other companies’ figures.
What does an investor pay for Kimco Realty today?
FFO is a more useful operating measure than ordinary profit for a property company. It adds back real-estate depreciation and removes property-sale gains, so selling an apartment building does not look like recurring rent. AFFO makes further adjustments for recurring costs, but its definition can vary. The price-to-FFO and price-to-AFFO multiples correspond to yields of about 7.5% and 5.4%; neither is cash guaranteed to shareholders.
| Today (Oct 30, 2026) | |
|---|---|
| Share price | 24.42 |
| Market value (calculated) | 16,226,842.601 |
| Price to FFO (calculated) | 13.3x |
| Price to AFFO (calculated) | 18.4x |
| Dividend yield (calculated) | 4.6% |
What this means. The price to adjusted funds from operations ratio actually uses the company’s diluted funds available for distribution, a different profit measure, so it may not match the stated definition.