Federal Realty Investment Trust stock forecast 2027–2029
MyStockButler's October 2026 analysis: Federal Realty Investment Trust's weighted scenario is $111.82 in October 2027, a 6% total return including dividends. Federal Realty Investment Trust's path hinges on rent starts, redevelopment and Summit leasing progressing together.
Where could Federal Realty Investment Trust's shares go?
The forecast's central path produces moderate gains, but the range of outcomes is wide. The weighted price is $111.82 at the first date, a 6% total return including dividends. It reaches $117.61 at the second date, a 15% return. At the final date, $123.73 represents a 25% return.
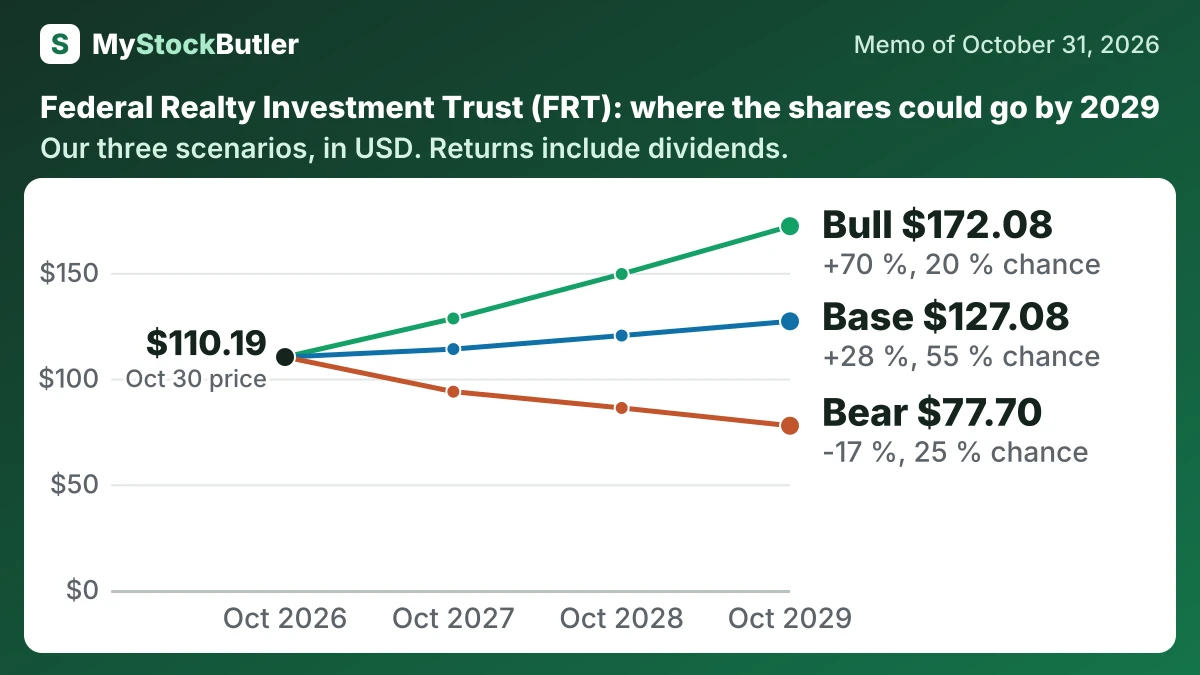
At October 2029, the bear case is $77.70. The bull case is $172.08. Today’s price is $110.19, so the forecast offers meaningful downside as well as substantial upside.
| Case | Probability | October 2027 | October 2028 | October 2029 |
|---|---|---|---|---|
| Bear | 25 % | 93.80 (-11 %) | 86.10 (-13 %) | 77.70 (-17 %) |
| Base | 55 % | 113.96 (+8 %) | 120.35 (+18 %) | 127.08 (+28 %) |
| Bull | 20 % | 128.44 (+21 %) | 149.46 (+44 %) | 172.08 (+70 %) |
| Weighted | 100 % | 111.82 (+6 %) | 117.61 (+15 %) | 123.73 (+25 %) |
What has to go right or wrong for Federal Realty Investment Trust?
The bear case gives $647 million at the first date, remains at $647 million at the second and falls to $641 million at the final date. Delayed starts from the roughly $42 million signed-but-not-commenced rent pool and refinancing pressure explain the weak path. The bull case reaches $685 million, then $745 million and $810 million because rent starts, redevelopment and Summit leasing progress together. Strong comparable leasing and management’s growth targets support that outcome.
How much cash does Federal Realty Investment Trust really make?
Operating cash flow supplies a second test. Federal Realty generated $622.4 million of operating cash in 2025 and $507.0 million in the first nine months of 2026. During those nine months, it spent $128.1 million on development and redevelopment and $89.9 million on other capital expenditure. Leasing costs added another $15.4 million. These categories are not all maintenance, but they show why FFO and cash available for distribution are not interchangeable.
| 2025 | 2024 | 2023 | 2022 | 2021 | |
|---|---|---|---|---|---|
| Core FFO | 610,991 | 570,708 | |||
| Core FFO per share | 7.06 | 6.77 | |||
| Dividends paid | 388,058 | 371,586 | 359,194 | 347,284 | 335,656 |
| Core FFO payout ratio | 63.2% | 64.7% |
What this means. The dividends paid figures include money paid to both common and preferred shareholders because the company does not show those payments separately.
What does an investor pay for Federal Realty Investment Trust today?
Reported earnings per share were approximately $5.00 over the four quarters through September 2026, producing a P/E of about 22 times. FFO, or funds from operations, adds back building depreciation and removes property-sale gains, so it better describes recurring property operations. It is not cash in the bank, because it does not automatically subtract every repair, leasing cost, tenant improvement or debt payment.
| Today (Oct 31, 2026) | |
|---|---|
| Share price | 110.19 |
| Market value (calculated) | 9,478,715.586 |
| Price to FFO (calculated) | 14.8x |
| Price to Core FFO (calculated) | 14.8x |
| Dividend yield (calculated) | 4.2% |