Regency Centers stock forecast 2027–2029
MyStockButler's October 2026 analysis: The weighted forecast reaches $77.77 in October 2027, $81.02 in October 2028 and $84.88 in October 2029. It hinges on lease conversion, project returns and manageable financing.
Where could Regency Centers' shares be by 2029?
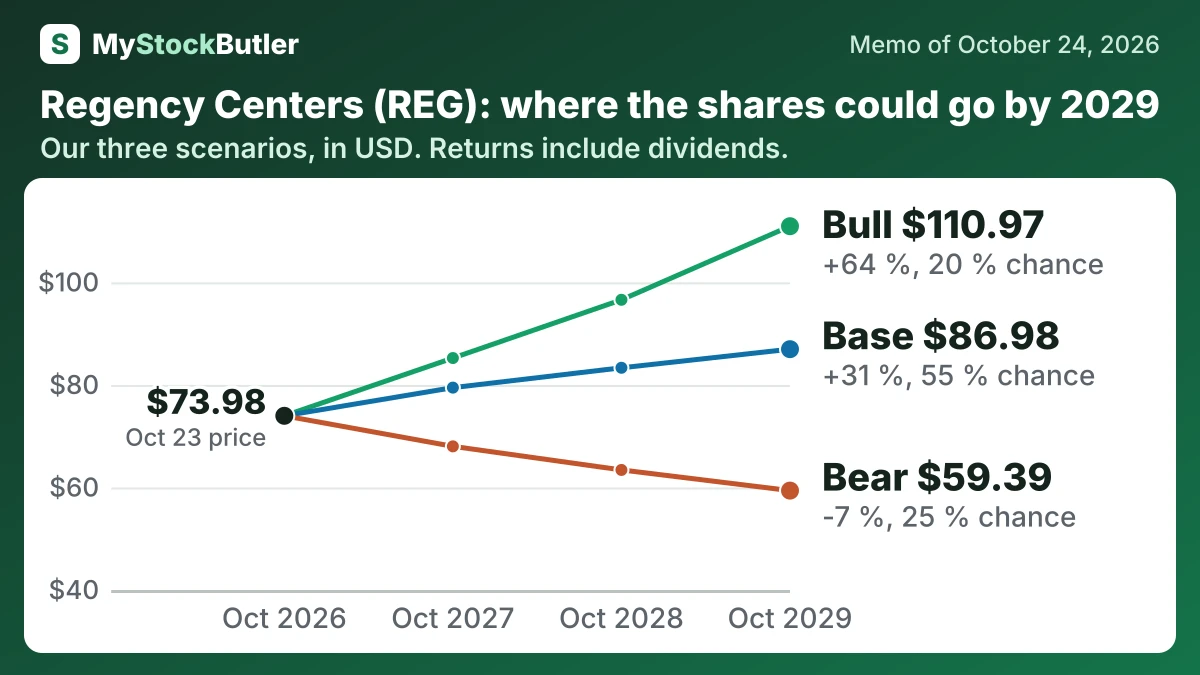
Regency Centers is forecast at $77.77 in October 2027, $81.02 in October 2028 and $84.88 in October 2029. Including dividends, those outcomes represent gains of 9%, 18% and 28% from today’s $73.98. The range is much wider by the final date: $59.39 in the bear case versus $110.97 in the bull case. The probabilities are 25% bear, 55% base and 20% bull.
| Case | Probability | October 2027 | October 2028 | October 2029 |
|---|---|---|---|---|
| Bear | 25 % | 68.02 (-4 %) | 63.42 (-6 %) | 59.39 (-7 %) |
| Base | 55 % | 79.48 (+12 %) | 83.35 (+21 %) | 86.98 (+31 %) |
| Bull | 20 % | 85.25 (+19 %) | 96.61 (+39 %) | 110.97 (+64 %) |
| Weighted | 100 % | 77.77 (+9 %) | 81.02 (+18 %) | 84.88 (+28 %) |
What has to go right, and what could go wrong for Regency Centers?
The forecast starts from approximately $850 million of 2026 AFFO, using the midpoint of the July Core Operating Earnings guide as a proxy. The latest quarter reported Core Operating Earnings per share of $1.16, while Core Operating Earnings rose from $631.164 million in 2021 to $813.249 million in 2025. The base case applies growth of 5.2%, 5.0% and 4.5%, producing the table’s $894 million, $939 million and $981 million. This reflects signed leases becoming rent, project openings and then slower growth as occupancy is already high. The bear case reaches $866 million, $875 million and $893 million because commencements slow and financing absorbs more gains. The bull case reaches $918 million, $982 million and $1,041 million because leasing and development outperform. The evidence for upside is 96.9% leased space, 94.5% commenced space and a 10.4% comparable cash spread. The pipeline was about 49% spent at an estimated 9% blended yield.
How much cash does Regency Centers really make?
Regency reported Core Operating Earnings of $813.249 million, or $4.41 per share, for 2025. Its separately defined AFFO reconciliation deducted $137.335 million of operating capital expenditures alone. That deduction is why FFO should not be treated as cash freely available for dividends.
The payout trend nevertheless looks disciplined. The stated payout ratio was 65.1% in 2025, close to 65.5% in 2021. Dividend per share rose from $2.41 in 2021 to $2.87 in 2025. Operating cash flow was about $827.7 million in 2025, while common dividends paid were $511.564 million.
| 2025 | 2024 | 2023 | 2022 | 2021 | |
|---|---|---|---|---|---|
| Core Operating Earnings | 813,249 | 760,662 | 700,856 | 660,840 | 631,164 |
| Core Operating Earnings per share | 4.41 | 4.13 | 3.95 | 3.83 | 3.68 |
| Dividends paid | 511,564 | 490,365 | 453,065 | 428,276 | 403,085 |
| Core Operating Earnings payout ratio | 65.1% | 65.7% | 66.3% | 65.9% | 65.5% |
What does an investor pay for Regency Centers today?
P/E is a poor starting point because accounting depreciation reduces earnings even when a well-located center becomes more valuable and its rent rises. FFO adds back real-estate depreciation and removes property-sale gains, making recurring property operations easier to compare. It is not cash in the bank, however, because roofs, tenant improvements and financing still cost money.
| Today (Oct 24, 2026) | |
|---|---|
| Share price | 73.98 |
| Market value (calculated) | 13,547.258 |
| Price to FFO (calculated) | 15.64x |
| Price to Core Operating Earnings (calculated) | 16.33x |
| Dividend yield (calculated) | 4.1% |
What this means. The dividend is shown as $0.76 after rounding, but the company's exact amount is $0.755, which we use for calculations.