Iron Mountain earnings date and guidance
MyStockButler's October 2026 analysis: Iron Mountain's next results are expected on November 5, 2026. Iron Mountain should be watched for cash conversion alongside construction spending.
What has Iron Mountain guided for 2026?
On August 5, 2026, management raised its full-year revenue and AFFO-per-share guidance. At the midpoint, revenue implies approximately 16% growth and AFFO per share approximately 14%. That is a substantial promise for a company using its established records business to help finance newer operations.
| Period guided | Low | High | Date given | |
|---|---|---|---|---|
| Total Revenue | Year to Dec 2026 | 7,940 | 8,010 | Aug 5, 2026 |
| Adjusted EBITDA | Year to Dec 2026 | 2,945 | 2,975 | Aug 5, 2026 |
| AFFO | Year to Dec 2026 | 1,760 | 1,780 | Aug 5, 2026 |
| AFFO Per Share | Year to Dec 2026 | 5.87 | 5.93 | Aug 5, 2026 |
| capital expenditures for growth investment | Year to Dec 2026 | 2,050.0 | 2,050.0 | Aug 5, 2026 |
| recurring capital expenditures | Year to Dec 2026 | 150.0 | 150.0 | Aug 5, 2026 |
Has Iron Mountain kept its past promises?
AFFO guidance appears cautious: all five annual results met or beat the original ranges, and three exceeded their upper bounds. No reviewed annual AFFO range was cut or withdrawn, with increases during 2021 and 2025. There was no comparable AFFO miss requiring a one-off explanation, and using management's prior-definition USD 3.97 result for 2023 avoids counting the accounting-definition change as a beat.
| Metric | Record, last 5 years | Typical gap |
|---|---|---|
| AFFO per diluted share | 5 of 5 inside or above both initial and final guidance; 3 above the top; no cuts or withdrawals. | Median result approximately 0.7% above the initial range's upper bound; individual gaps ranged from -0.8% to +4.4%. All comparisons use USD per diluted share and the AFFO definition underlying each forecast. |
What is Iron Mountain's revenue and profit trend?
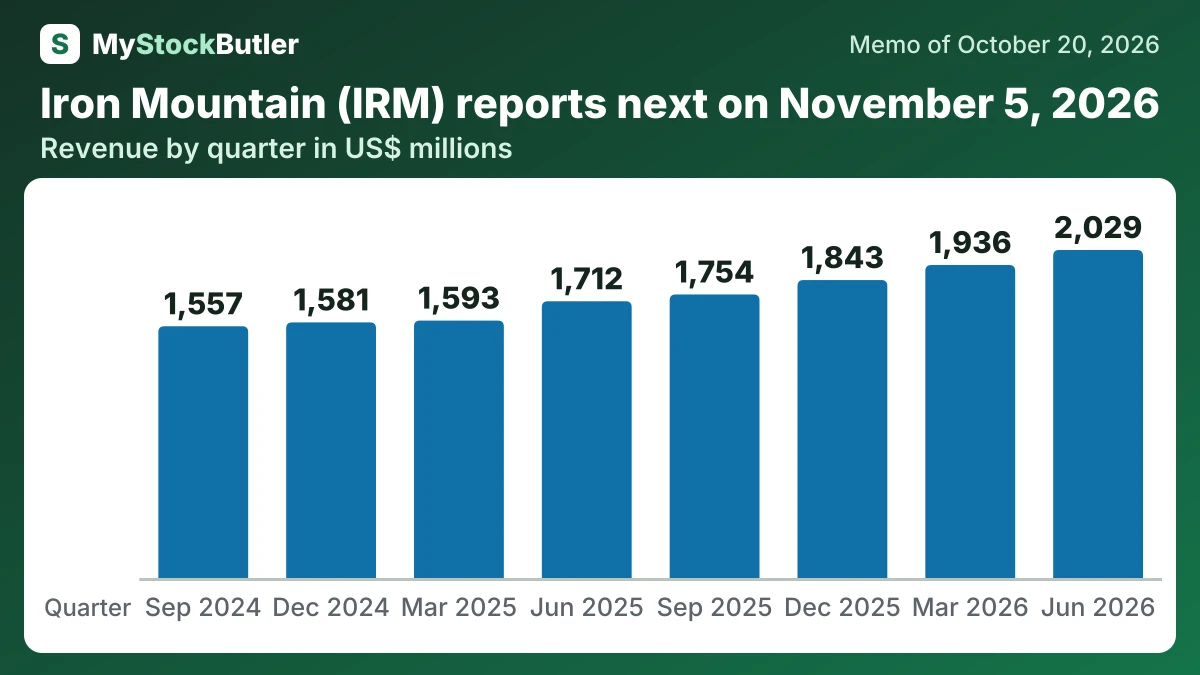
The June 2026 quarter confirmed strong growth, but the improvement was helped by currency, timing, and the disappearance of restructuring charges.
| Jun 2026 | Mar 2026 | Dec 2025 | Sep 2025 | Jun 2025 | Mar 2025 | Dec 2024 | Sep 2024 | |
|---|---|---|---|---|---|---|---|---|
| Revenue | 2,029,062 | 1,936,149 | 1,843,167 | 1,754,093 | 1,711,948 | 1,592,529 | 1,581,279 | 1,557,358 |
| Storage-rental gross profit | 799,498 | 760,425 | 746,659 | 734,942 | 727,960 | 675,285 | 676,401 | 672,349 |
| FFO per share | 0.76 | 0.89 | 0.70 | 0.67 | 0.21 | 0.38 | 0.67 | 0.23 |
| AFFO per share (company's measure) | 1.44 | 1.43 | 1.44 | 1.32 | 1.24 | 1.17 | 1.24 | 1.13 |
| Dividend per share | 0.86 | 0.86 | 0.86 | 0.79 | 0.79 | 0.79 | 0.72 | 0.72 |
| AFFO payout ratio | 60.0% | 60.4% | 60.0% | 59.5% | 63.3% | 67.1% | 57.7% | 63.3% |
What this means. The adjusted funds from operations payout ratio shown here is calculated from one quarter, while the company's printed ratio uses the last four quarters.
What should Iron Mountain watch in the next results?
Iron Mountain is scheduled to release September-quarter results on November 5, 2026. The useful comparison is not only with guidance, but also between operating cash and the remaining construction commitments. A higher earnings target is less persuasive if the cash required to achieve it rises just as quickly.
Physical delivery is the next test. Miami MIA-1 and Virginia VA-9 Phase 1 are scheduled for completion and stabilization in the fourth quarter of 2026. VA-9 Phase 2 and London are scheduled for completion and stabilization in the first quarter of 2027; Madrid is scheduled for completion that quarter and stabilization in the fourth quarter of 2027. Completion brings a building online; stabilization shows whether it has reached its intended operating level.