Iron Mountain dividend: cash coverage and yield
MyStockButler's October 2026 analysis: Iron Mountain pays a $0.86 quarterly dividend. The dividend remained covered in the June 2026 quarter, although first-half 2026 cash flow was below capex before dividends.
How much does Iron Mountain pay its shareholders over time?
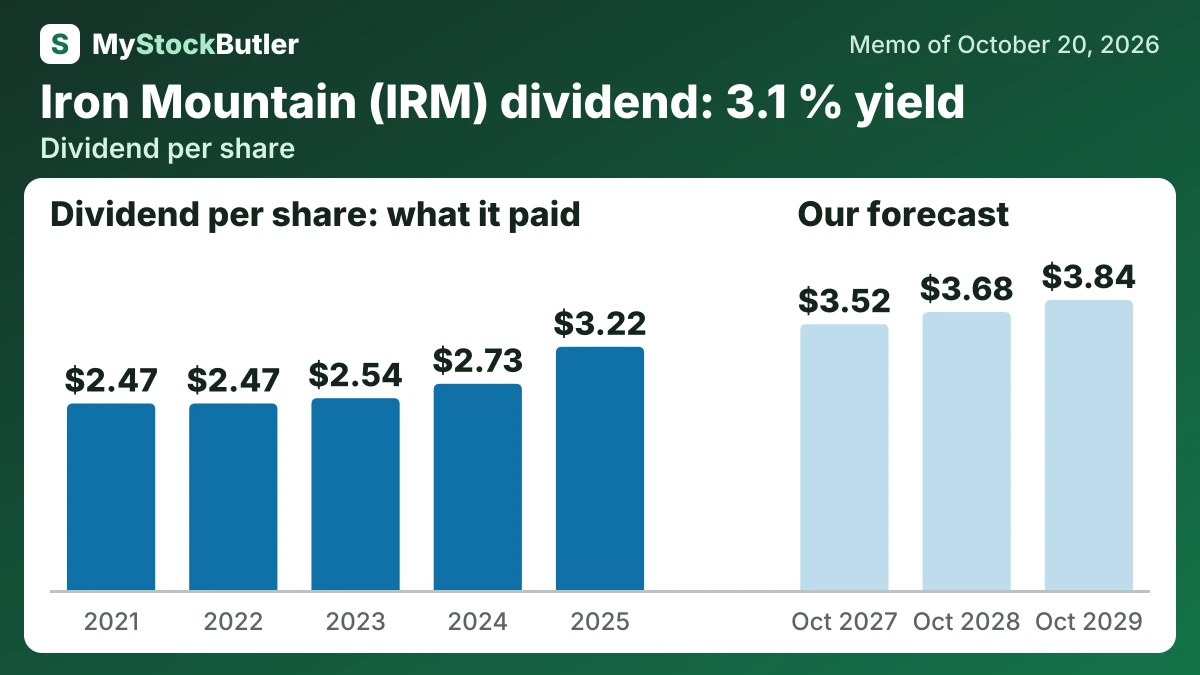
The $0.86 quarterly dividend remained covered, with a stated payout ratio of 60.0%. The quarter shows real expansion, but not every dollar of growth should be annualized. The fuller issue is how Iron Mountain finances that expansion.
Dividends remain flat at $3.44 per share in the bear case. The base case raises them to $3.52, $3.68 and $3.84. The bull case reaches $3.60, $3.96 and $4.32. The base reflects a current quarterly rate of $0.86 and a 60% payout ratio. It also reflects a dividend that rose in four of the last five years, while first-half cash generation remained below capex before dividends.
| 2025 | 2024 | 2023 | 2022 | 2021 | |
|---|---|---|---|---|---|
| FFO per share | 1.96 | 1.93 | 1.76 | 2.71 | 2.27 |
| AFFO per share (company's measure) | 5.17 | 4.54 | 4.12 | 3.93 | 3.48 |
| Dividend per share | 3.22 | 2.73 | 2.54 | 2.47 | 2.47 |
| AFFO payout ratio | 62.2% | 60.0% | 61.6% | 62.9% | 71.2% |
What this means. The adjusted funds from operations per share is the company’s own profit measure, so it may not be directly comparable with other companies’ figures.
Does Iron Mountain cover its dividend with cash?
In 2025, total cash capex was 2,271,628, producing free cash flow of negative 931,629 before dividends. In the first half of 2026, operating cash flow was 887,813 and cash capex was 1,106,206. Free cash flow was therefore negative 218,393, and cash dividends of 532,742 widened the funding gap.
Borrowing filled the gap between internally generated cash and investment needs. Debt issued and debt repaid can both be enormous because revolving credit facilities may be borrowed and repaid repeatedly. Those gross flows do not equal fresh expansion capital. Share issuance through employee plans and compensation is also different from raising public equity to finance construction, and Iron Mountain recorded no share buybacks from 2021 through 2025.
| 2025 | 2024 | 2023 | 2022 | 2021 | |
|---|---|---|---|---|---|
| Cash from operations | 1,339,999 | 1,196,708 | 1,113,567 | 927,695 | 758,902 |
| − Dividends paid | 919,388 | 789,527 | 737,650 | 724,388 | 718,340 |
| = Operating cash after dividends | 420,611 | 407,181 | 375,917 | 203,307 | 40,562 |
| − Development and capital spending | 2,271,628 | 1,791,564 | 1,339,223 | 875,378 | 611,082 |
| − Shares bought back | 0 | 0 | 0 | 0 | 0 |
What this means. The blank acquisition rows do not mean the company bought nothing, because purchases of land and buildings are included in development and capital spending instead.
What could change Iron Mountain's dividend?
The view would move toward the bear case if energization or lease commencements slip between October 2027 and October 2028. Persistent capex above internally generated cash through 2029 would add debt and interest pressure. Records withdrawals outpacing new intake would weaken organic revenue despite pricing.
| October 2027 | October 2028 | October 2029 | |
|---|---|---|---|
| AFFO (company's measure) | 1,947 (1,720 / 2,047) | 2,142 (1,754 / 2,354) | 2,334 (1,807 / 2,684) |
| Shares (millions) | 300 (301 / 299) | 303 (305 / 301) | 306 (308 / 302) |
| Dividends per share | 3.52 (3.44 / 3.60) | 3.68 (3.44 / 3.96) | 3.84 (3.44 / 4.32) |
| Price to AFFO (company's measure) | 18.00 (15.00 / 21.00) | 17.00 (13.00 / 22.00) | 16.00 (12.00 / 22.00) |
What this means. The company changed how it measures profit and revised 2022, so older and newer figures may not be directly comparable.