Iron Mountain stock forecast 2027–2029
MyStockButler's October 2026 analysis: Iron Mountain’s weighted forecast is $114.31 by October 2027 and $123.82 by October 2029. It hinges on converting the data-center pipeline into cash returns without weakening the records base.
Where could Iron Mountain’s shares be by 2029?
The bear case probability is 25%. The base case probability is 55%. The bull case probability is 20%. The September 2026 quarter, due November 5, 2026, tests whether growth and guidance convert into cash alongside construction spending. Miami MIA-1 and Virginia VA-9 Phase 1 are due for completion and stabilization in Q4 2026; VA-9 Phase 2, London and Madrid follow in Q1 2027, except that Madrid is expected to stabilize in Q4 2027. Management expects approximately 325 MW to energize over the following 24 months. Lease commencements, final project costs and stabilized returns will determine whether that capacity earns its keep. The investment turns on converting the data-center pipeline into cash returns without weakening the records base.
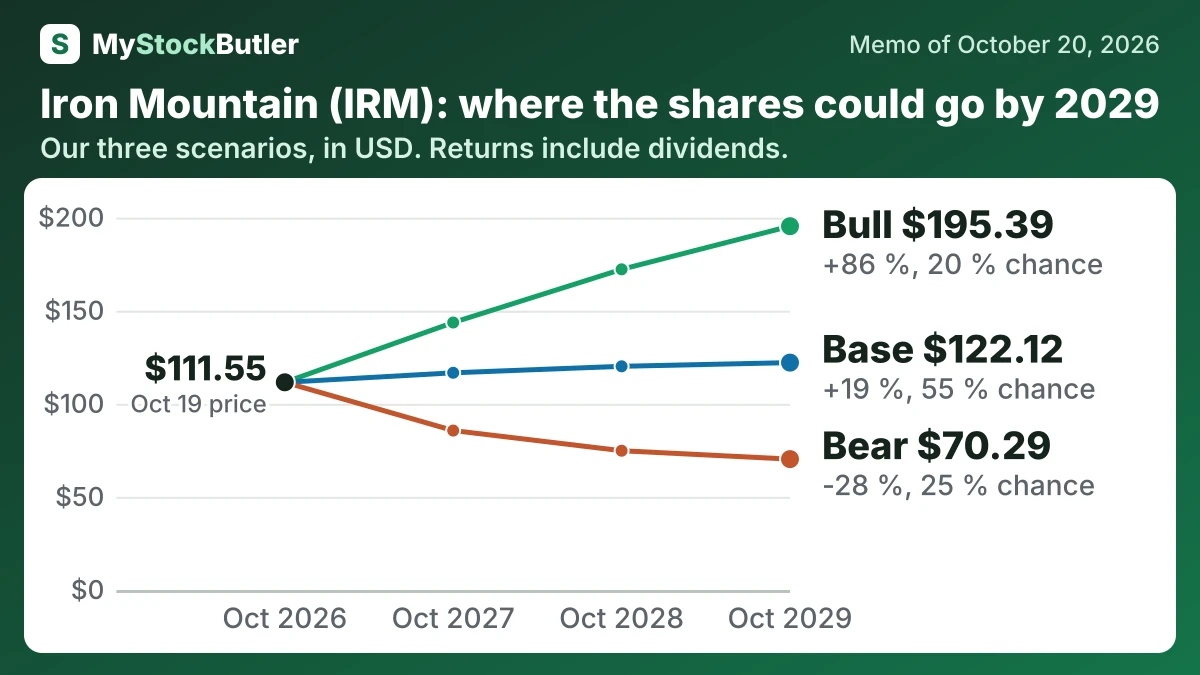
| Case | Probability | October 2027 | October 2028 | October 2029 |
|---|---|---|---|---|
| Bear | 25 % | 85.63 (-20 %) | 74.79 (-27 %) | 70.29 (-28 %) |
| Base | 55 % | 116.66 (+8 %) | 120.14 (+14 %) | 122.12 (+19 %) |
| Bull | 20 % | 143.67 (+32 %) | 172.22 (+61 %) | 195.39 (+86 %) |
| Weighted | 100 % | 114.31 (+6 %) | 119.22 (+13 %) | 123.82 (+21 %) |
What this means. The Weighted row is the probability-based average of the three cases, not a guaranteed share price.
What has to go right for Iron Mountain’s base case, and what could go wrong?
The base path reflects AFFO growth in every year from 2021 through 2025 and the 2025 result exceeding guidance. It also requires phased data-center commencements, records pricing and continued demand, while growth capex remains a cash burden. Management expects about 325 MW to energize over 24 months, but power and construction delays could defer rent. First-half 2026 capex exceeded operating cash flow, which supports the bear case.
The bull case requires power connections, construction, renewals and digital services to succeed together. New capacity becomes cash generative, debt growth slows and investors accept a premium multiple. The price reaches $143.67 first and $195.39 last. Its 20% probability reflects strong demand and expected energization, but also the number of dependencies required for sustained 14–15% AFFO growth.
How much cash does Iron Mountain really make?
In 2025, total cash capex was 2,271,628, producing free cash flow of negative 931,629 before dividends. In the first half of 2026, operating cash flow was 887,813 and cash capex was 1,106,206. Free cash flow was therefore negative 218,393, and cash dividends of 532,742 widened the funding gap.
| 2025 | 2024 | 2023 | 2022 | 2021 | |
|---|---|---|---|---|---|
| AFFO (company's measure) | 1,541,170 | 1,344,540 | 1,211,165 | 1,150,541 | 1,011,899 |
| AFFO per share (company's measure) | 5.17 | 4.54 | 4.12 | 3.93 | 3.48 |
| Dividends paid | 919,388 | 789,527 | 737,650 | 724,388 | 718,340 |
| AFFO payout ratio | 62.2% | 60.0% | 61.6% | 62.9% | 71.2% |
What this means. The payout percentages may not equal dividends divided by profit per share because the trust uses more precise figures and a trailing twelve-month calculation.
What does an investor pay for Iron Mountain today?
At $111.55 on October 20, 2026, investors were paying 19.8 times AFFO. Adjusted funds from operations is Iron Mountain’s estimate of recurring cash earnings after interest, normalized taxes and recurring capital expenditure. It is useful, but it is not cash left after every investment: in Q2 2026, the company reported $433 million of AFFO, $38 million of recurring capital expenditure and $553 million of growth capital expenditure. New data centers belong mainly to the last category.
| Today (Oct 20, 2026) | |
|---|---|
| Share price | 111.55 |
| Market value (calculated) | 33,208,748.679 |
| Price to FFO (calculated) | 36.9x |
| Price to AFFO (calculated) | 19.8x |
| Dividend yield (calculated) | 3.1% |
What this means. The price to funds from operations and price to adjusted funds from operations figures show how many dollars investors pay for each dollar of the trust’s yearly profit measure, so a higher number means a more expensive share.