Hartford earnings date and guidance
MyStockButler's October 2026 analysis: Hartford's next results are expected on February 4, 2027. Watch whether Hartford can integrate Equitable and defend Employee Benefits margins.
What has Hartford guided for 2026?
The long-term Employee Benefits net income margin outlook is 6.0%–7.0%. The relevant comparison is therefore the net income margin, not the lower core margin. Hartford’s $4.2 billion repurchase authorization is also permission to buy shares, not a promise to spend the full amount. Buybacks can lift earnings per share by reducing the share count, but they also use cash that could support claims, growth, or dividends. The real test is whether premium growth leaves a durable margin, which analysts now try to forecast.
| Period covered | Low | High | Date given | |
|---|---|---|---|---|
| Employee Benefits long-term net income margin outlook | Long term | 6.0% | 7.0% | Feb 20, 2026 |
| Share repurchase authorization (US$ billions) | Aug 1, 2026 to Dec 31, 2028 | 4.2 | Jul 23, 2026 | |
| Business Insurance growth in written premium | 2026 | Feb 20, 2026 | ||
| Personal Insurance written premium growth | 2026 | Feb 20, 2026 | ||
| Employee Benefits growth in fully insured ongoing premiums | 2026 | Feb 20, 2026 |
What this means. The share repurchase authorization is only the maximum amount the company may spend buying back its shares, not a promise that it will spend all of it.
Did Hartford keep its past promises?
Hartford also has a record of meeting a prior operating promise. It projected core ROE of 13–14% for 2022–2023. It later reported 14.5% for 2022 and 15.8% for 2023. The next test is operational: management has identified underwriting, customer service, billing, and claims as areas for artificial-intelligence work. Investors should look for measurable improvements in cost and service, not enthusiasm alone.
What is Hartford's revenue and profit trend?
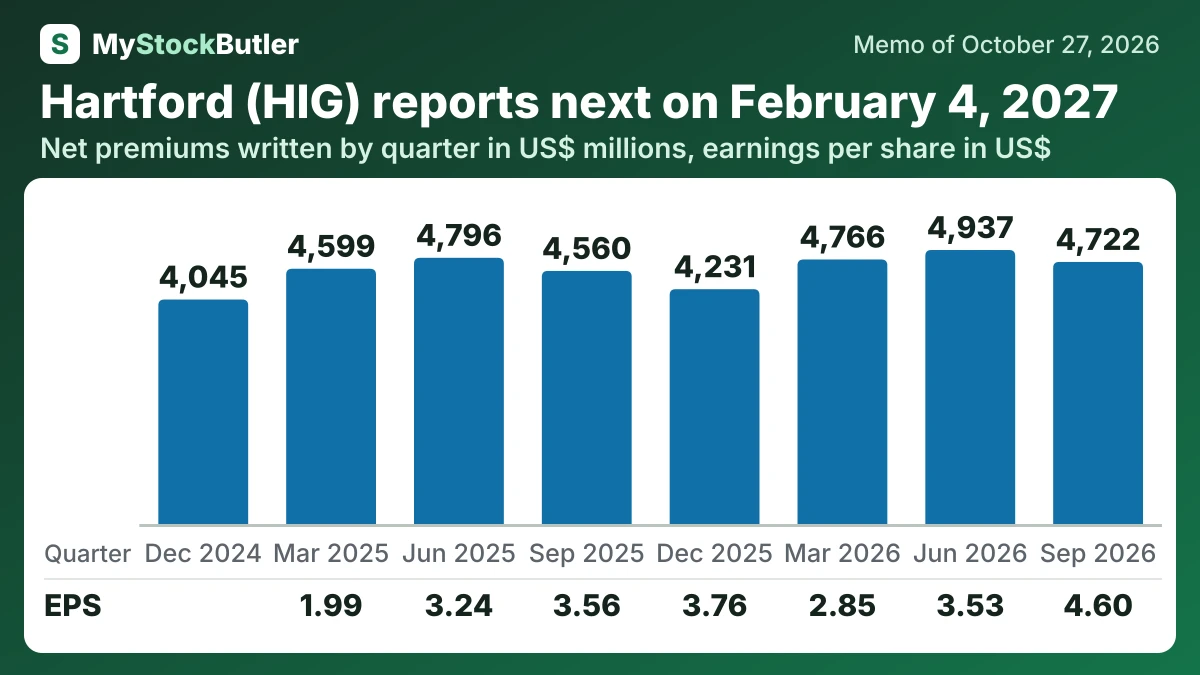
Continuing income reached $1.3 billion, but core earnings declined to $956 million. Hartford ended the asbestos agreement with National Indemnity, receiving $1.1 billion and recording a $393 million after-tax gain. Removing that gain reduces quarterly continuing income to $869 million and EPS to $3.16.
| Sep 2026 | Jun 2026 | Mar 2026 | Dec 2025 | Sep 2025 | Jun 2025 | Mar 2025 | Dec 2024 | |
|---|---|---|---|---|---|---|---|---|
| Net premiums written | 4,722 | 4,937 | 4,766 | 4,231 | 4,560 | 4,796 | 4,599 | 4,045 |
| Combined ratio | 91.2% | 92.6% | 87.1% | 88.8% | 88.6% | 96.9% | 92.1% | |
| Core earnings (company's measure) | 956 | 945 | 812 | 1,087 | 1,022 | 932 | 592 | |
| Income from continuing operations, net of tax | 1,262 | 980 | 804 | 1,069 | 1,021 | 938 | 584 | |
| EPS from continuing operations, diluted | 4.60 | 3.53 | 2.85 | 3.76 | 3.56 | 3.24 | 1.99 |
What this means. The company's core earnings differ from income from continuing operations because they exclude unusual items, such as the September 2026 gain from changing its asbestos and environmental insurance coverage.
What should people watch in Hartford's next results?
The fourth quarter of 2026 is the first reporting period that includes the acquired business. Hartford should distinguish acquired premium from underlying growth and explain integration costs. Its year-end parent cash position will also show how much capital Employee Benefits is retaining rather than distributing.