Hartford stock forecast 2027–2029
MyStockButler's October 2026 analysis: Hartford's weighted forecast reaches $173.58 by October 2029, a 34% return including dividends. It hinges on pricing, reserves, disability claims and Equitable integration improving together.
Where could Hartford's shares be by 2029?
At October 2027, the weighted price is $138.75. That implies a 4% return including dividends. At October 2029, it is $173.58, implying a 34% return. The bear case has 25% probability. The base case has 55% probability, and the bull case 20%.
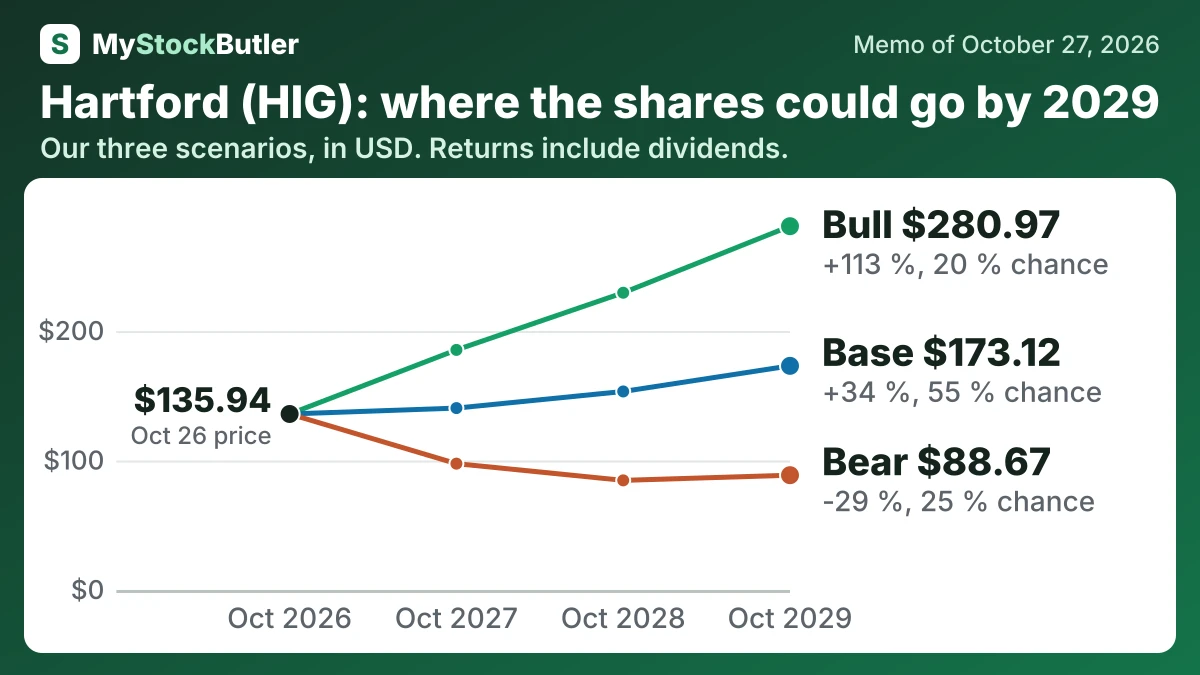
| Case | Probability | October 2027 | October 2028 | October 2029 |
|---|---|---|---|---|
| Bear | 25 % | 97.57 (-26 %) | 84.67 (-34 %) | 88.67 (-29 %) |
| Base | 55 % | 140.49 (+5 %) | 153.34 (+17 %) | 173.12 (+34 %) |
| Bull | 20 % | 185.42 (+38 %) | 229.57 (+73 %) | 280.97 (+113 %) |
| Weighted | 100 % | 138.75 (+4 %) | 151.42 (+15 %) | 173.58 (+34 %) |
What has to go right, and what could go wrong for Hartford?
The bear case gives earnings of $3,187 million, then $2,882 million, before $2,990 million. It assumes premiums still grow, but margins fall to 12.4%, 11.0% and 11.2% as reserves and claims offset that growth. The bull case reaches $3,900 million, $4,247 million and $4,640 million because pricing, reserves, disability claims and the acquisition all improve together.
How much cash does Hartford really make?
Operating cash flow was $5.9 billion in 2025, but free cash flow is not automatically distributable: premiums arrive before many claims, and the surplus must remain invested. EBITDA-based debt tests also obscure insurance economics because they ignore investment income and policyholder liabilities.
What does an investor pay today for Hartford?
A 10.6x forward P/E implies approximately $12.82 of earnings per share over the next twelve months. That is an earnings hurdle, not a cash dividend or a promise. If sustainable earnings fell by one-fifth, they would be about $10.26 per share. The same share price would then equal approximately 13.3x earnings, making the stock look much less inexpensive without any price decline.
| Today (Oct 27, 2026) | |
|---|---|
| Share price | 135.94 |
| P/E, last 12 months (calculated) | 9.2x |
| P/E on core earnings, last 12 months (calculated) | 9.9x |
| P/E, next 12 months (calculated) | 10.6x |
| Price to book (calculated) | 2.0x |
| Dividend yield (calculated) | 2.0% |
What this means. The two price-to-earnings numbers differ because one uses all reported profit, while the other uses Hartford’s own measure of ongoing profit.