Huntington earnings
MyStockButler's October 2026 analysis: Huntington's next results are expected on January 28, 2027. Watch whether Huntington turns Cadence savings into durable EPS while keeping credit losses and capital in control.
What has Huntington guided for the year?
The bank’s main engine is net interest income: interest earned on loans and investments minus interest paid to depositors and other funders. If Huntington raises deposit rates to retain customers while loan rates move more slowly, that spread narrows. Management expects 2026 net interest income to rise 35.0% and core expenses to rise 33.0%, with the EPS target at $1.52–$1.54.
| Period it covers | Low | High | Date given | |
|---|---|---|---|---|
| Net Interest Income | FY2026 growth | 35.0% | 35.0% | Oct 22, 2026 |
| Implied Revenue Growth | FY2026 growth | 34.0% | 34.0% | Oct 22, 2026 |
| Core Expenses | FY2026 growth | 33.0% | 33.0% | Oct 22, 2026 |
| EPS (FY2026) | FY2026 | 1.52 | 1.54 | Oct 22, 2026 |
| EPS (FY2027) | FY2027 | 1.75 | 1.83 | Oct 22, 2026 |
What this means. The bank’s adjusted common equity tier one safety cushion differs from its reported regulatory cushion because the two measures count some gains and losses differently.
Did Huntington keep its past promises?
Its delivery record is mixed. Lending and income forecasts were not consistently conservative, while credit losses were more reassuring. Management also reduced net interest income and lending guidance when funding costs and interest-rate pressure increased, so analysts must separate genuine execution from acquisitions and changed assumptions.
| What management forecast | Checked | Above | Within | Below |
|---|---|---|---|---|
| Average Loans | 4 years | 2 | 0 | 2 |
| Net Interest Income | 4 years | 2 | 1 | 1 |
| Net Charge-offs | 4 years | 0 | 2 | 2 |
What do Huntington's recent results show?
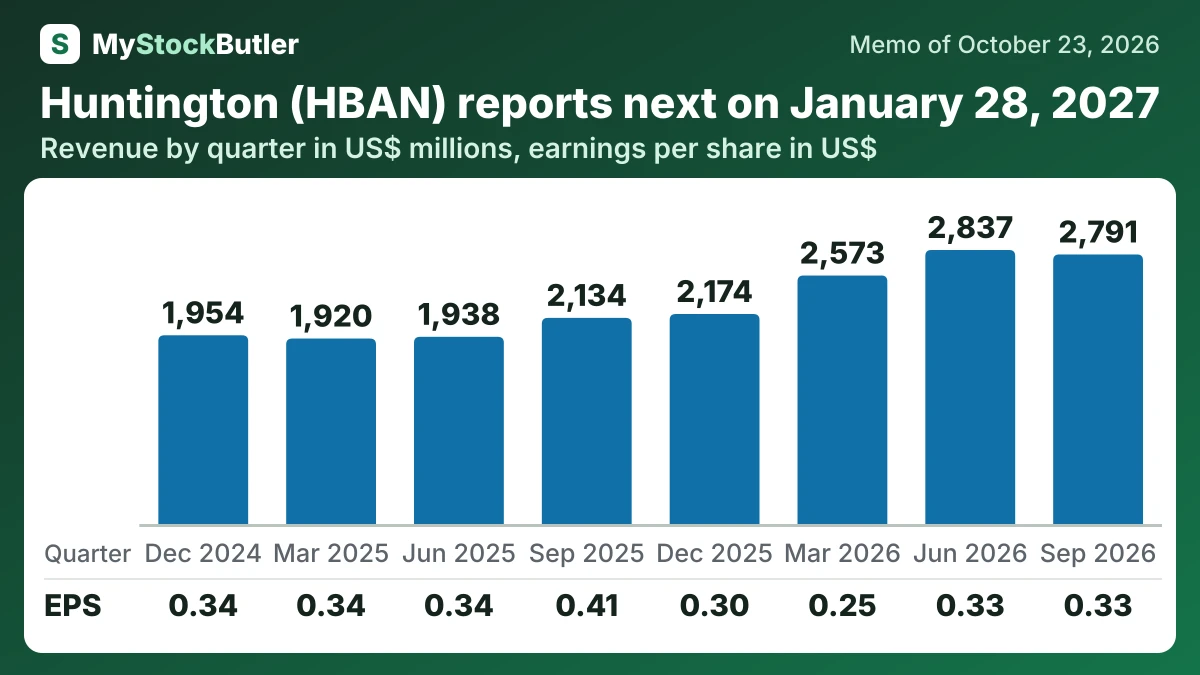
Sequentially, NIM improved while revenue declined because capital-markets income and other fees weakened. Acquisition expenses also reduced reported earnings. The company’s adjusted bridges are useful, but they retain acquired earnings and continuing intangible amortization. Net margin can move with provisions and taxes, so it does not replace analysis of the lending spread.
| Sep 2026 | Jun 2026 | Mar 2026 | Dec 2025 | Sep 2025 | Jun 2025 | Mar 2025 | Dec 2024 | |
|---|---|---|---|---|---|---|---|---|
| Revenue | 2,791 | 2,837 | 2,573 | 2,174 | 2,134 | 1,938 | 1,920 | 1,954 |
| Net interest income | 2,069 | 2,052 | 1,891 | 1,592 | 1,506 | 1,467 | 1,426 | 1,395 |
| Net income | 721 | 727 | 523 | 519 | 629 | 536 | 527 | 530 |
| EPS, diluted | 0.33 | 0.33 | 0.25 | 0.30 | 0.41 | 0.34 | 0.34 | 0.34 |
| Net interest margin | 3.3% | 3.2% | 3.2% | 3.2% | 3.1% | 3.1% | 3.1% | 3.0% |
| CET1 capital ratio | 10.1% | 10.0% | 10.2% | 10.4% | 10.6% | 10.5% | 10.6% | 10.5% |
What this means. Revenue for the first nine months of 2026 includes recently bought businesses, so comparing it with the same period in 2025 is not an apples-to-apples comparison.
What should investors watch in Huntington's next release?
Operating evidence should arrive with fourth-quarter and full-year 2026 results and continue through 2027. Watch whether core expenses remain flat sequentially, whether lending earns an adequate return, and whether credit losses stay within the assumed 25–35 basis-point annual range. A basis point is one-hundredth of a percentage point, so that range represents roughly $2.50–$3.50 of annual net write-offs per $1,000 of average loans.