Huntington dividend: history and coverage
MyStockButler's October 2026 analysis: Huntington's dividend has remained near $0.62 for four years, with a current annual pace of $0.62, and the forecast shows $0.62, $0.64 and $0.66 per share. Huntington's payout uses roughly half of trailing earnings, leaving the rest to support growth, absorb losses and strengthen the balance sheet.
How much does Huntington pay in dividends over the years shown?
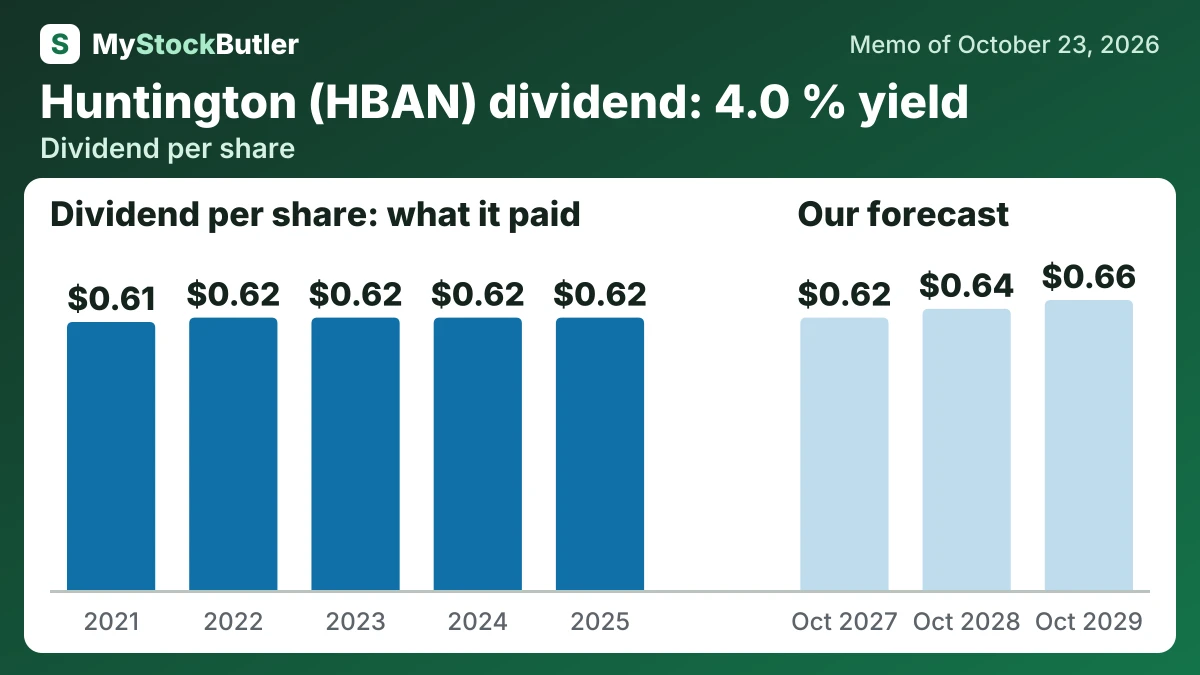
Base dividends are $0.62, $0.64 and $0.66 per share. The first value matches the current annual pace after the latest $0.155 quarterly declaration, while later increases reflect moderate earnings growth and a payout around the mid-30% range. The bear case holds dividends at $0.60 after a modest cut; the bull case reaches $0.64, $0.68 and $0.72. Huntington’s dividend has remained near $0.62 for four years, so stability is better supported than rapid growth.
| 2025 | 2024 | 2023 | 2022 | 2021 | |
|---|---|---|---|---|---|
| Net income | 2,211 | 1,940 | 1,951 | 2,238 | 1,295 |
| EPS, diluted | 1.39 | 1.22 | 1.24 | 1.45 | 0.90 |
| Dividend per share | 0.62 | 0.62 | 0.62 | 0.62 | 0.61 |
| Return on equity | 10.8% | 10.4% | 11.2% | 13.2% | 7.9% |
What this means. For a bank, revenue is mainly interest earned on loans and investments plus fees, not just money from selling products.
Does Huntington's dividend fit its earnings and capital?
From 2022 through 2025, Huntington generally kept about half of common earnings after dividends and made no common buybacks in 2025. The table also shows why 2021 requires a different reading: dividends and buybacks exceeded common earnings on the reported basis, while adjusted earnings presented a stronger picture. Adjusted earnings can clarify ongoing performance, but merger costs still consume resources.
The dividend must pass both a profit test and a capital test. Huntington’s payout uses roughly half of trailing earnings, leaving the rest to support growth, absorb losses and strengthen the balance sheet. Its third-quarter 2026 CET1 ratio was 10.1%. CET1 is common shareholders’ capital measured against risk-weighted assets, so it shows whether the bank has a sufficient cushion after paying dividends and funding new loans.
| 2025 | 2024 | 2023 | 2022 | 2021 | |
|---|---|---|---|---|---|
| Net income | 2,211 | 1,940 | 1,951 | 2,238 | 1,295 |
| = Earnings for common shareholders | 2,087 | 1,801 | 1,817 | 2,125 | 1,153 |
| − Dividends declared on common shares | 938 | 916 | 911 | 908 | 826 |
| − Share buybacks | 0 | 0 | 0 | 0 | 650 |
| = Kept to grow and build capital | 1,149 | 885 | 906 | 1,217 | |
| = Paid out more than it earned | 323 |
What this means. The company's own adjusted profit for ordinary shareholders is higher because it adds back the after-tax cost of intangible assets wearing out and leaves out certain notable items.
What could change Huntington's dividend?
Management targets $1.52–$1.54 EPS for FY2026. It also targets 34.0% revenue growth and 35.0% net interest income growth. For FY2027, it guides to $1.75–$1.83 EPS. It also guides to 17.0%–18.0% adjusted ROTCE—return on tangible common equity, a measure of profit earned on shareholders’ core investment. It plans $1,300–$1,400 million of buybacks in FY2027. It expects $150 million of incremental acquisition savings that year.
The view would move toward the bear case if funding competition reduces net interest income, as Huntington’s sensitivity work already shows under a lower-rate path. Rising criticized loans, provisions or vehicle losses would reinforce that move. Delayed Cadence savings or higher regulatory costs would also weaken earnings and buyback capacity.
| October 2027 | October 2028 | October 2029 | |
|---|---|---|---|
| Book value | 30,250 (29,150 / 30,650) | 31,480 (28,600 / 32,750) | 32,960 (28,800 / 35,500) |
| Shares (millions) | 1,953 (1,944 / 1,958) | 1,904 (1,930 / 1,895) | 1,859 (1,917 / 1,838) |
| Dividends per share | 0.62 (0.60 / 0.64) | 0.64 (0.60 / 0.68) | 0.66 (0.60 / 0.72) |
| Price to book value | 1.02 (0.85 / 1.16) | 1.05 (0.78 / 1.25) | 1.08 (0.78 / 1.32) |
What this means. Price to book value shows how much investors pay for each dollar of the company's net assets.