Key stock forecast 2027–2029
MyStockButler's October 2026 analysis: The weighted forecast is 18.86 in October 2027 and 20.88 in October 2029, with 27% bear, 53% base, and 20% bull probabilities. It hinges on credit costs, CET1, recurring fee growth, and buybacks.
Where could Key's shares be by October 2029?
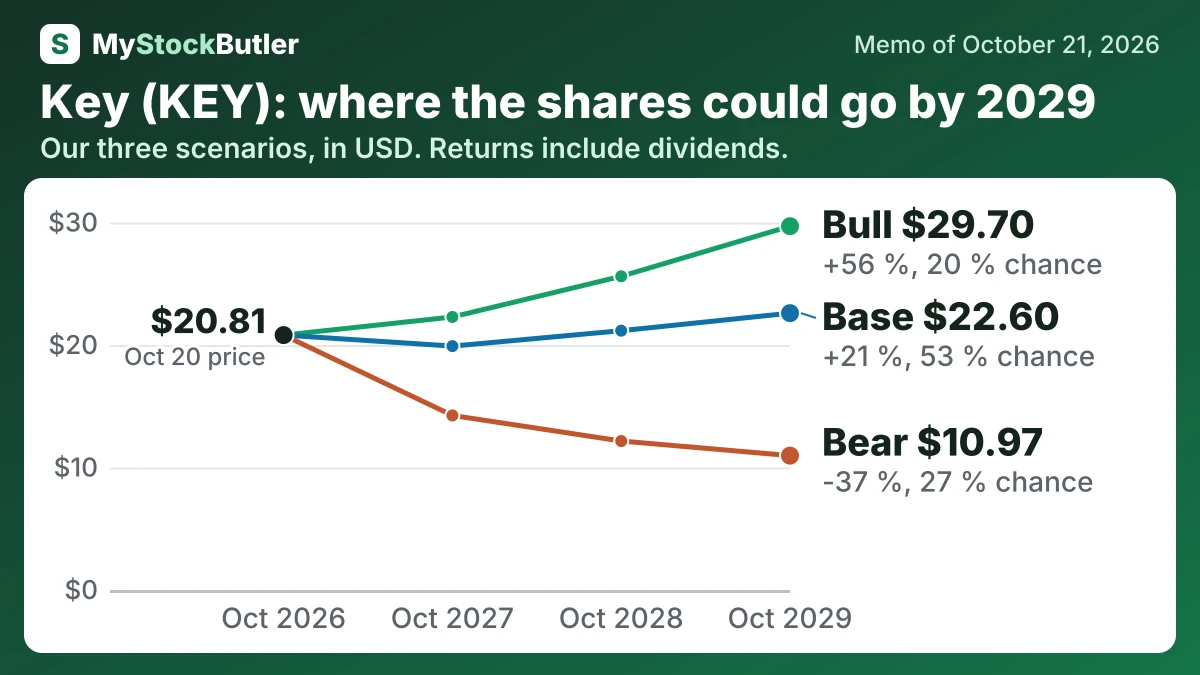
The weighted forecast is 18.86 in October 2027, a negative 5% total return, and 20.88 in October 2029, a positive 12% total return. It assigns 27% probability to the bear case, 53% to the base case, and 20% to the bull case. January 20, 2027 is the next checkpoint for Q4 results, 2027 targets, and buyback plans. Through 2027–2029, credit costs, CET1, recurring fee growth, and buybacks decide the outcome.
| Case | Probability | October 2027 | October 2028 | October 2029 |
|---|---|---|---|---|
| Bear | 27 % | 14.25 (-28 %) | 12.16 (-35 %) | 10.97 (-37 %) |
| Base | 53 % | 19.91 (-0 %) | 21.17 (+10 %) | 22.60 (+21 %) |
| Bull | 20 % | 22.29 (+11 %) | 25.61 (+31 %) | 29.70 (+56 %) |
| Weighted | 100 % | 18.86 (-5 %) | 19.62 (+2 %) | 20.88 (+12 %) |
What this means. The Weighted row is the probability-based average of the Bear, Base, and Bull cases, not a fourth prediction.
What has to go right for Key's base case, and what could go wrong?
The bear case requires deposit costs to stop falling while commercial borrowers draw credit and losses rise. Earnings weaken, capital is consumed, buybacks slow, and investors assign a lower multiple. The price reaches $14.25 in the first forecast year and $10.97 by October 2029. Its 27% probability reflects uninsured deposits, marked CET1 of 9.0%, and the possibility that funding and credit pressure arrive together.
The bull case requires faster deposit-cost relief, continued asset repricing, stronger commercial fee growth, and controlled expenses. Higher recurring earnings support larger buybacks, stronger book value per share, and a higher valuation. The price reaches $22.29 initially and $29.70 by the final date. Its 20% probability reflects the need for several outcomes to persist, including returns above 15%, adequate capital, and a multiple above current peer benchmarks.
| 2025 | 2024 | 2023 | 2022 | 2021 | |
|---|---|---|---|---|---|
| Revenue | 7,478 | 4,574 | 6,383 | 7,245 | 7,265 |
| Net interest margin | 2.7% | 2.2% | 2.2% | 2.6% | 2.5% |
| Efficiency ratio (lower is leaner) | 62.3% | 97.8% | 73.2% | 60.0% | 59.9% |
| Charged to profit for bad loans | 471 | 335 | 489 | 502 | |
| CET1 capital ratio | 11.8% | 11.9% | 10.0% | 9.1% | 9.5% |
What this means. The bank’s “released from bad-loan reserves” is money added back to profit because earlier loss estimates were too high, not new money earned from customers.
How much does Key earn and give back?
The five-year figures show a 2024 securities-repositioning loss followed by a 2025 recovery in revenue and net interest margin, while efficiency is distorted by the loss. Credit measures improved, but provisions and charge-offs still determine how much earnings add to the capital cushion; 2025 earnings again covered distributions despite the Scotiabank issuance changing the share count.
| 2025 | 2024 | 2023 | 2022 | 2021 | |
|---|---|---|---|---|---|
| Net interest income | 4,636 | 3,765 | 3,913 | 4,527 | 4,071 |
| Revenue | 7,478 | 4,574 | 6,383 | 7,245 | 7,265 |
| Net income | 1,828 | -163 | 964 | 1,911 | 2,612 |
| EPS, diluted | 1.52 | -0.32 | 0.88 | 1.92 | 2.62 |
| Dividend per share | 0.82 | 0.82 | 0.82 | 0.79 | 0.75 |
What this means. The negative $418 million provision in 2021 means the bank released money it had previously set aside for possible loan losses.
What does an investor pay for Key today?
At $20.81 on October 21, 2026, Key’s common shares had a market value of $22,020.64256 million. Investors paid 11.4 times the last twelve months’ earnings and 11.1 times expected next-twelve-month earnings. Because those figures are close, the price assumes steady rather than spectacular near-term growth.