Dollar General earnings date and guidance
MyStockButler's October 2026 analysis: Dollar General's next results are expected on December 3, 2026. Watch whether Dollar General's sales growth continues without another material tariff-refund benefit.
What has Dollar General guided for the year?
For the year ending January 2027, management guides to 4.0%–4.3% net sales growth, 2.5%–2.9% same-store sales growth at established stores, and diluted EPS of $7.80–$8.00. The EPS range includes a $0.25 tariff-refund benefit. Capital expenditures are planned at $1.4 billion–$1.5 billion, with up to $700 million in share repurchases after zero buybacks in the three fiscal years through January 2026.
| The period guided | Low | High | The date it was given | |
|---|---|---|---|---|
| Net sales growth | Year to Jan 2027 | 4.0% | 4.3% | Aug 27, 2026 |
| Same-store sales growth | Year to Jan 2027 | 2.5% | 2.9% | Aug 27, 2026 |
| Diluted EPS | Year to Jan 2027 | 7.80 | 8.00 | Aug 27, 2026 |
| Share repurchases | Year to Jan 2027 | 700,000 | Aug 27, 2026 | |
| Capital expenditures | Year to Jan 2027 | 1,400,000 | 1,500,000 | Aug 27, 2026 |
What this means. The share repurchase figure is only a maximum amount the company may spend, not a promise that it will spend that much.
Did Dollar General keep its past promises?
Management planned approximately 2,250 Project Elevate remodels for fiscal 2025 and forecast earnings per share of US$5.10–US$5.80. It delivered 2,254 remodels. Earnings per share reached US$6.85, so those promises were met, although future returns still matter.
| What management forecast | Checked | Above | Within | Below |
|---|---|---|---|---|
| Net sales growth | 5 years | 3 | 0 | 2 |
| Same-store sales growth | 5 years | 3 | 0 | 2 |
| Diluted EPS | 5 years | 2 | 0 | 3 |
What is Dollar General's revenue and profit trend?
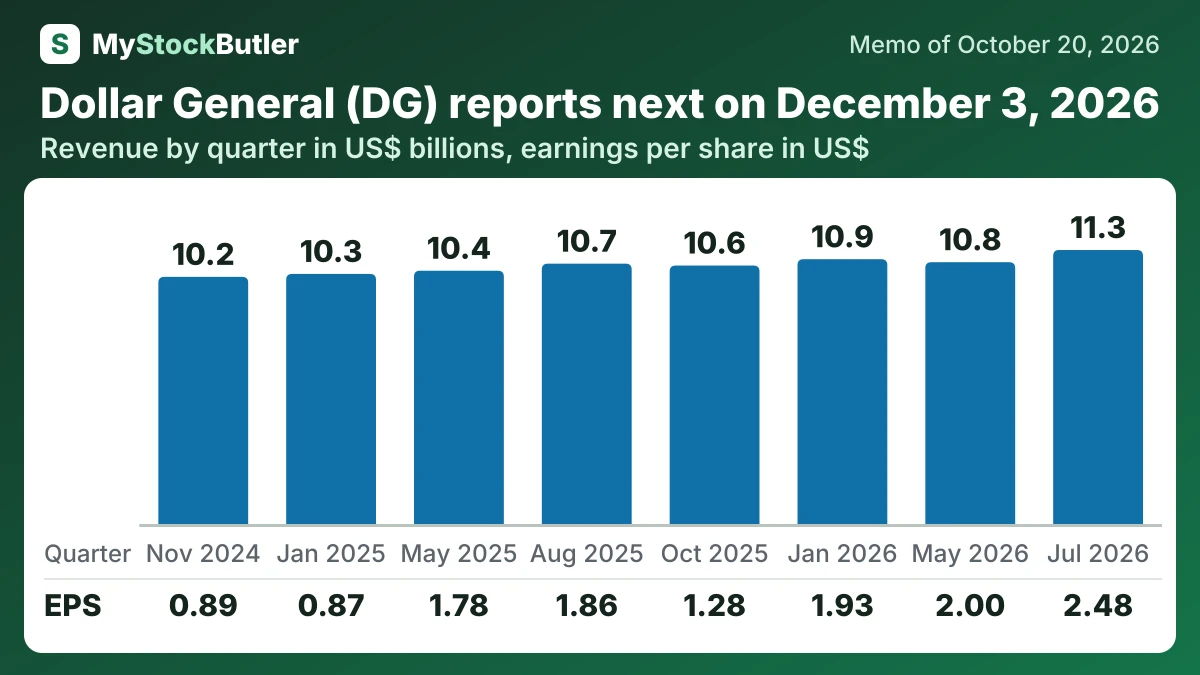
Revenue, operating income and diluted EPS all improved in the quarter ended July 31, 2026. Existing-store growth included both more transactions and larger baskets, so the recovery did not rely wholly on new locations or higher prices.
Gross margin also improved. Tariff refunds contributed 81 basis points to gross margin after DG reinvested part of the benefit in prices and promotions. They contributed 66 basis points to operating margin and $0.25 to EPS. Removing those benefits still leaves progress, but it makes the earnings recovery materially smaller.
| Jul 2026 | May 2026 | Jan 2026 | Oct 2025 | Aug 2025 | May 2025 | Jan 2025 | Nov 2024 | |
|---|---|---|---|---|---|---|---|---|
| Revenue | 11,290,380 | 10,786,965 | 10,911,203 | 10,649,450 | 10,727,737 | 10,435,979 | 10,304,498 | 10,183,428 |
| Gross margin | 32.6% | 31.6% | 30.4% | 29.9% | 31.3% | 31.0% | 29.4% | 28.8% |
| Operating income | 769,164 | 638,516 | 606,276 | 425,851 | 595,428 | 576,113 | 294,206 | 323,802 |
| Net income | 550,315 | 444,127 | 426,300 | 282,657 | 411,426 | 391,928 | 191,217 | 196,529 |
| EPS, diluted | 2.48 | 2.00 | 1.93 | 1.28 | 1.86 | 1.78 | 0.87 | 0.89 |
What this means. The July 2026 gross margin was helped by tariff refunds, so it was higher than the company’s normal profit from selling goods.
What should investors watch in Dollar General's next results?
The next earnings release is expected around December 3, 2026. It should show whether sales growth continues without another material tariff-refund benefit, whether inventory releases cash and how much DG spends on buybacks. The fiscal year ends January 29, 2027; annual results released afterward should show whether management met its promises and completed the planned remodels.