Dollar General stock forecast 2027–2029
MyStockButler's October 2026 analysis: Dollar General's 55% base-case, probability-weighted price is $128.77 by October 2027, versus shares starting at $134.21. It hinges on whether higher traffic, better in-stocks, lower shrink and remodels produce durable profit.
Where could Dollar General's shares be by October 2029?
The forecast points to limited near-term appreciation and a wide range of outcomes. The shares start at $134.21. The probability-weighted price is $128.77 by October 2027, a negative 2% total return including dividends. By October 2028, it reaches $135.62, a 4% gain. By October 2029, it reaches $148.22, a 16% gain.
The last-date range runs from $82.87 in the bear case to $221.96 in the bull case. The base case carries the highest probability at 55%. The bear case receives 25%, while the bull case receives 20%.
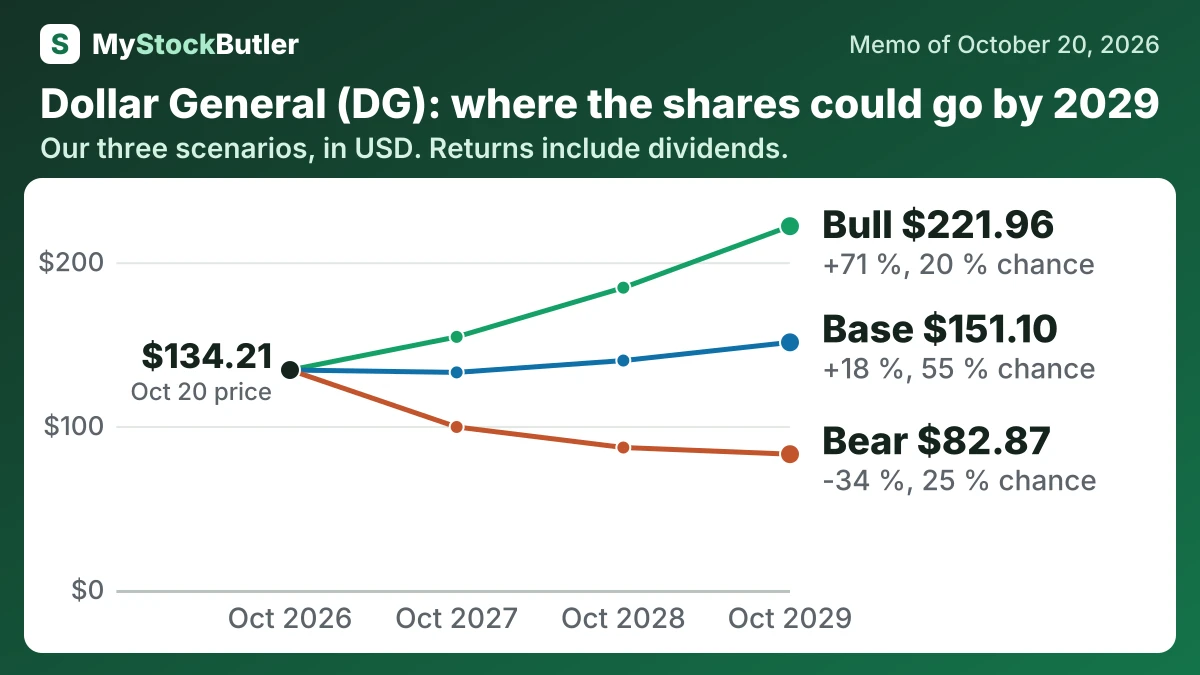
| Case | Probability | October 2027 | October 2028 | October 2029 |
|---|---|---|---|---|
| Bear | 25 % | 99.46 (-24 %) | 86.93 (-32 %) | 82.87 (-34 %) |
| Base | 55 % | 132.76 (+1 %) | 139.99 (+8 %) | 151.10 (+18 %) |
| Bull | 20 % | 154.43 (+17 %) | 184.46 (+41 %) | 221.96 (+71 %) |
| Weighted | 100 % | 128.77 (-2 %) | 135.62 (+4 %) | 148.22 (+16 %) |
What this means. The weighted row is the probability-based average of the bear, base, and bull cases, not a separate prediction.
What has to go right for Dollar General, and what could go wrong?
That approach fits a consistently profitable retailer better than an asset-value or portfolio approach. It also makes the central uncertainty explicit: whether higher traffic, better in-stocks, lower shrink and remodels produce durable profit.
| October 2027 | October 2028 | October 2029 | |
|---|---|---|---|
| Earnings | 1,790 (1,550 / 1,850) | 1,860 (1,450 / 2,050) | 1,980 (1,500 / 2,300) |
| Shares (millions) | 216 (218 / 216) | 213 (217 / 211) | 210 (217 / 207) |
| Dividends per share | 2.36 (2.36 / 2.36) | 2.36 (1.77 / 2.48) | 2.36 (1.77 / 2.60) |
| Price to earnings | 16.00 (14.00 / 18.00) | 16.00 (13.00 / 19.00) | 16.00 (12.00 / 20.00) |
How much cash does Dollar General really make?
Deducting stock-based compensation produces an analytical “real free cash flow” figure. It is not an extra cash payment in the period, but it recognizes that employees received ownership claims. The dividend must ultimately be supported by cash left after adequate investment.
| Jan 2026 | Jan 2025 | Feb 2024 | Feb 2023 | Jan 2022 | |
|---|---|---|---|---|---|
| Cash from operations | 3,634,500 | 2,996,064 | 2,391,798 | 1,984,555 | 2,865,811 |
| − Capital spending | 1,241,162 | 1,309,888 | 1,700,222 | 1,560,582 | 1,070,460 |
| = Free cash flow | 2,393,338 | 1,686,176 | 691,576 | 423,973 | 1,795,351 |
| − Stock pay | 91,453 | 58,738 | 51,891 | 72,712 | 78,178 |
| = Real free cash flow | 2,301,885 | 1,627,438 | 639,685 | 351,261 | 1,717,173 |
What this means. Real free cash flow is lower because share-based pay does not use cash but still gives employees part of the company.
What does an investor pay for Dollar General today?
P/E means the share price divided by profit per share. Trailing P/E uses the latest twelve months; forward P/E uses an estimate of the next twelve. The forward figure therefore assumes that the recovery continues. That assumption deserves scrutiny because fiscal 2026 earnings included approximately $0.25 per share from tariff refunds after related reinvestment, which is not automatically recurring.