Dollar Tree stock forecast 2027–2029
MyStockButler's October 2026 analysis: Dollar Tree's weighted scenario is $110.09 in October 2027, $126.68 in October 2028, and $145.24 in October 2029. Dollar Tree's forecast hinges on temporary tariff benefits giving way to durable traffic, multi-price economics and store returns.
Where could Dollar Tree's shares go?
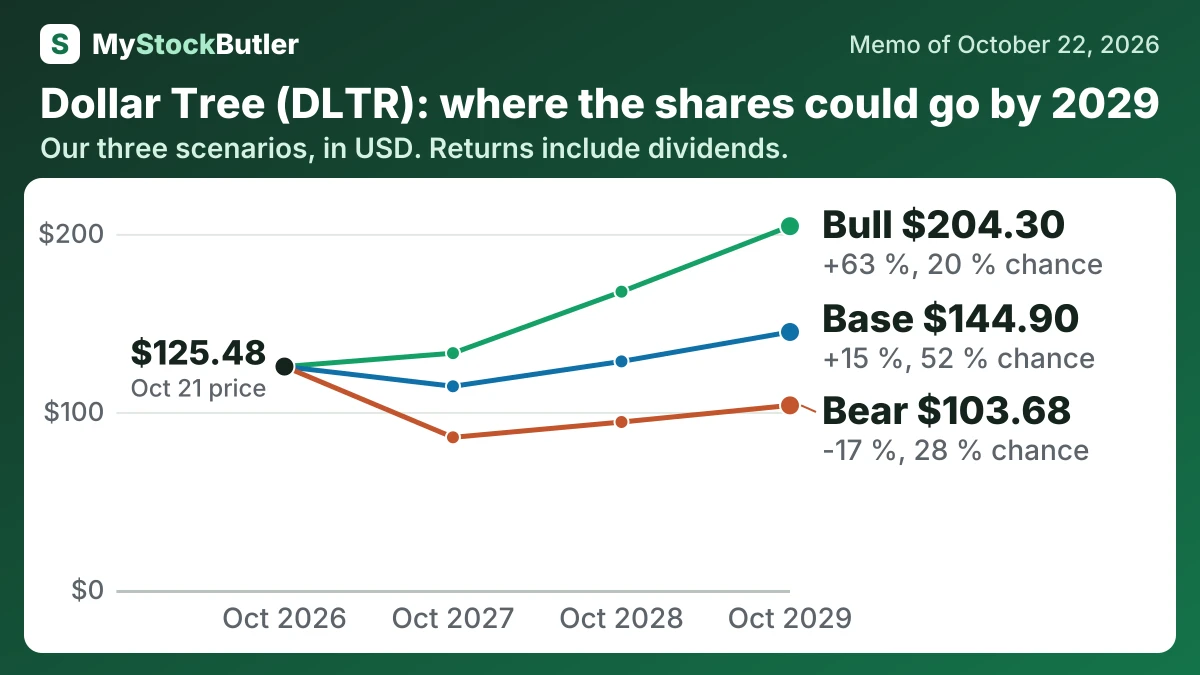
The forecast points to near-term pressure but moderate upside over three years. The probability-weighted price is $110.09 in October 2027, a 12% negative total return including dividends. It reaches $126.68 in October 2028, a 1% positive return. By October 2029, it reaches $145.24, a 16% return from today’s $125.48.
| Case | Probability | October 2027 | October 2028 | October 2029 |
|---|---|---|---|---|
| Bear | 28 % | 85.74 (-32 %) | 94.34 (-25 %) | 103.68 (-17 %) |
| Base | 52 % | 114.39 (-9 %) | 128.38 (+2 %) | 144.90 (+15 %) |
| Bull | 20 % | 133.01 (+6 %) | 167.53 (+34 %) | 204.30 (+63 %) |
| Weighted | 100 % | 110.09 (-12 %) | 126.68 (+1 %) | 145.24 (+16 %) |
What has to go right for Dollar Tree, and what could go wrong?
Distribution and store spending would reinforce the bear case if free cash flow and buybacks weakened while Marietta ramps in spring 2027. The base case would strengthen if sales stayed within management’s 5%–7% plan and underlying EPS advanced at 8%–10% as temporary benefits faded.
How much cash does Dollar Tree really make?
Stock compensation deserves another deduction when judging owners’ cash. Dollar Tree adds it back because no cash leaves when the expense is recorded, but shareholders bear dilution or the cost of offsetting repurchases. Deducting $58.9 million of stock pay leaves January 2026 real free cash flow of $997.8 million.
| Jan 2026 | Feb 2025 | Feb 2024 | Jan 2023 | |
|---|---|---|---|---|
| Cash from operations | 2,190.7 | 2,193.3 | 2,400.8 | 1,417.9 |
| − Capital spending | 1,134.0 | 1,300.5 | 1,193.8 | 639.0 |
| = Free cash flow | 1,056.7 | 892.8 | 1,207.0 | 778.9 |
| = Real free cash flow | 997.8 | 785.9 | 1,130.7 | 687.4 |
What this means. The company's own free cash flow matches ours, but our real free cash flow is lower because we also count shares given to employees as a cost to shareholders.
What does an investor pay for Dollar Tree today?
The price-to-earnings ratio, or P/E, shows what investors pay for a dollar of annual profit. Dollar Tree trades at 15.3 times trailing earnings and 15.9 times expected earnings over the next twelve months. But the latest quarter, ended August 1, 2026, included $2.70 of EPS, of which $1.31 came from tariff refunds. Removing that benefit leaves approximately $1.39, so the apparent multiple may overstate repeatable earnings.
| Today (Oct 21, 2026) | |
|---|---|
| Share price | 125.48 |
| P/E, last 12 months (calculated) | 15.3x |
| P/E, next 12 months (calculated) | 15.9x |
| Free cash flow yield (calculated) | 4.5% |
| Real free cash flow yield (calculated) | 4.2% |
What this means. Enterprise value estimates what it would cost to buy the whole business by adding its debt and subtracting its cash, not just buying its shares.