Cboe stock forecast 2027–2029
MyStockButler's November 2026 analysis: Cboe's weighted price is $317.51 in November 2027, a 4% loss including dividends. Cboe's outlook hinges on activity becoming durable cash flow.
Where could Cboe's shares be by 2029?
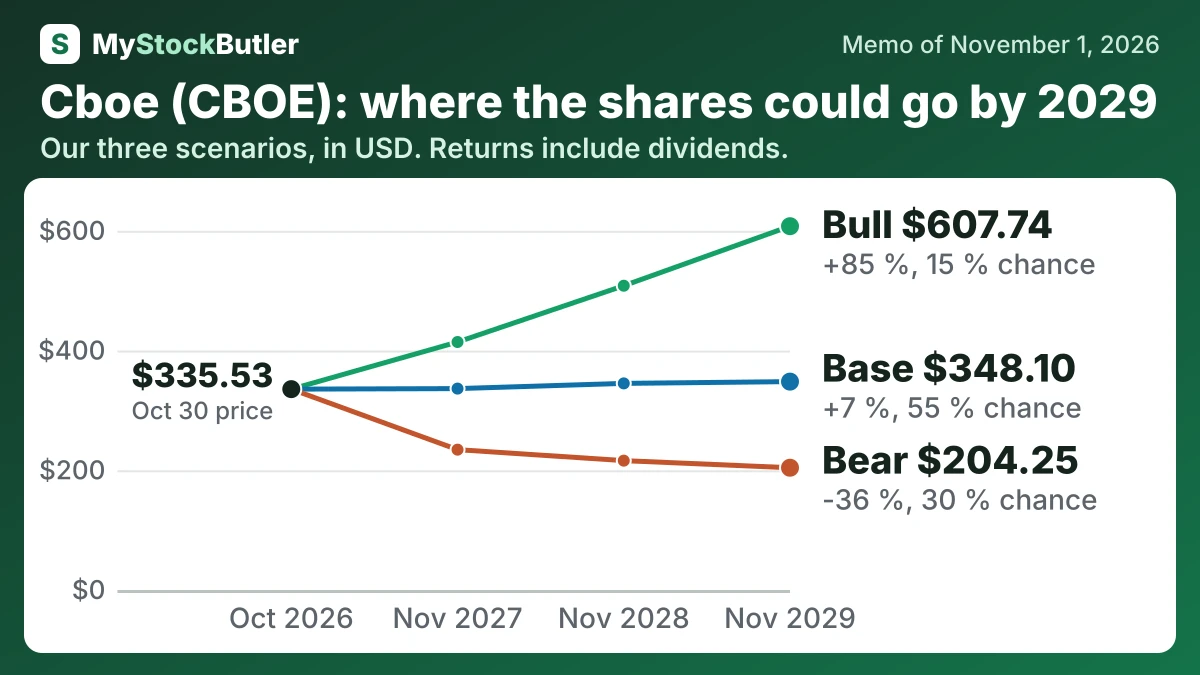
The weighted price is $317.51 in November 2027, a 4% loss including dividends. It reaches $330.90 in November 2028, a 1% gain. By November 2029, it reaches $343.89, a 6% gain.
The three-year range is $204.25 to $607.74. Today’s price is $335.53. The bear case gets 30% probability. The base case gets 55%. The bull case gets 15%.
| Case | Probability | November 2027 | November 2028 | November 2029 |
|---|---|---|---|---|
| Bear | 30 % | 234.44 (-29 %) | 216.10 (-34 %) | 204.25 (-36 %) |
| Base | 55 % | 336.43 (+1 %) | 345.14 (+5 %) | 348.10 (+7 %) |
| Bull | 15 % | 414.26 (+25 %) | 508.32 (+54 %) | 607.74 (+85 %) |
| Weighted | 100 % | 317.51 (-4 %) | 330.90 (+1 %) | 343.89 (+6 %) |
What has to go right or wrong for Cboe?
The bear path gives $1.360 billion in 2027 and $1.328 billion in 2028. It ends at $1.334 billion because index activity cools, multi-listed competition worsens and royalties compress margins. The risk is material: multi-listed options share fell from 24.9% to 24.0% year over year. The bull path reaches $1.722 billion, then $2.024 billion and $2.320 billion as SPX demand, Data Vantage and extended hours produce operating leverage. That requires more than the current EPS estimate, which implies roughly $1.60 billion of earnings.
The base case is solid growth without a lasting premium expansion. Options remain the core engine, Data Vantage expands and new hours contribute, but costs and royalties limit operating leverage. The price reaches $336.43 first and $348.10 last. Its 55% probability matches the earnings and multiple assessments, while stable dividends and gradual buybacks provide support.
| November 2027 | November 2028 | November 2029 | |
|---|---|---|---|
| Earnings | 1,593 (1,360 / 1,722) | 1,709 (1,328 / 2,024) | 1,807 (1,334 / 2,320) |
| Shares (millions) | 104 (104 / 104) | 104 (104 / 104) | 104 (104 / 103) |
| Dividends per share | 3.44 (3.44 / 3.60) | 3.72 (3.44 / 4.03) | 4.02 (3.44 / 4.51) |
| Price to earnings | 22.00 (18.00 / 25.00) | 21.00 (17.00 / 26.00) | 20.00 (16.00 / 27.00) |
How much cash does Cboe really make?
Free cash flow means operating cash flow less capital spending. “Real” free cash flow goes further by subtracting stock compensation. Stock pay is not a cash payment when recorded, but it can dilute shareholders or require cash spending to offset dilution. In 2025, free cash flow exceeded income allocated to common shareholders, even after that adjustment.
| 2025 | 2024 | 2023 | 2022 | 2021 | |
|---|---|---|---|---|---|
| Cash from operations | 1,752.6 | 1,100.6 | 1,075.6 | 651.1 | 596.8 |
| − Capital spending | 71.0 | 60.9 | 45.0 | 59.8 | 51.0 |
| = Free cash flow | 1,681.6 | 1,039.7 | 1,030.6 | 591.3 | 545.8 |
| − Stock pay | 50.4 | 41.8 | 41.3 | 30.7 | 26.6 |
| = Real free cash flow | 1,631.2 | 997.9 | 989.3 | 560.6 | 519.2 |
| Real free cash flow, % of revenue | 34.6% | 24.4% | 26.2% | 14.2% | 14.9% |
What this means. Real free cash flow is lower because paying employees with shares uses no cash today but gives away part of the company.