Brown & Brown earnings date and guidance
MyStockButler's October 2026 analysis: Brown & Brown's next results are expected on January 25, 2027. Watch whether promised savings become cash.
What has Brown & Brown guided for Accession synergies?
The October 27, 2026 update puts estimated 2026 EBITDAC synergies at $50 million and the annual savings run rate at $175 million by the end of 2028. EBITDAC means earnings before interest, taxes, depreciation, amortization and changes in estimated acquisition earn-out obligations. These are operating savings, not cash received by the company. Taxes, timing, reinvestment and debt payments mean they will not become an equal amount available to shareholders.
Amortization is a separate accounting charge. It spreads the purchase price of acquired customer relationships across the years they are expected to generate revenue, so it reduces reported earnings without requiring another payment. Brown & Brown estimates amortization of $450 million for 2026 and $431 million for 2027.
| The period guided | Low | High | The date it was given | |
|---|---|---|---|---|
| Estimated EBITDAC synergies | Full year 2026 | 50 | 50 | Oct 26, 2026 |
| Amortization expense for amortizable intangible assets — 2026 | Year to Dec 2026 | 450 | 450 | Feb 12, 2026 |
| Amortization expense for amortizable intangible assets — 2027 | Year to Dec 2027 | 431 | 431 | Feb 12, 2026 |
Did Brown & Brown keep its past promises?
The higher target comes with a higher bill. Brown & Brown now expects one-time integration costs of $250 million to $300 million, covering work such as severance, consultants, system migration and lease exits. Management says Accession’s first year met expectations for revenue, adjusted margin and adjusted earnings per share, while financial systems, human resources, compensation, offices and wholesale operations reached major integration milestones.
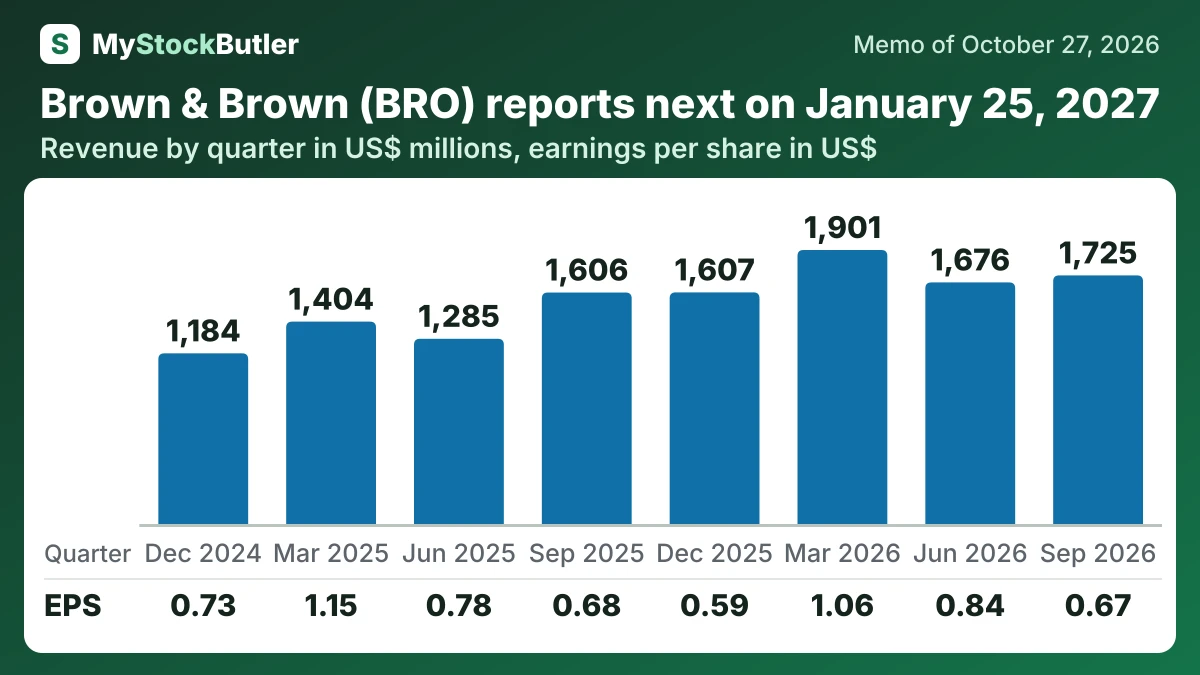
What do Brown & Brown's last eight quarters show?
| Sep 2026 | Jun 2026 | Mar 2026 | Dec 2025 | Sep 2025 | Jun 2025 | Mar 2025 | Dec 2024 | |
|---|---|---|---|---|---|---|---|---|
| Revenue | 1,725 | 1,676 | 1,901 | 1,607 | 1,606 | 1,285 | 1,404 | 1,184 |
| Operating income | 420 | 483 | 632 | 421 | 411 | 362 | 473 | 321 |
| Net income | 240 | 288 | 426 | 264 | 227 | 231 | 331 | 210 |
| EPS, diluted | 0.67 | 0.84 | 1.06 | 0.59 | 0.68 | 0.78 | 1.15 | 0.73 |
What should investors watch in Brown & Brown's next results?
At the full-year 2026 results, compare delivered synergies with the target and ask how much integration work remains. During 2027, look for lower recurring expenses and stronger cash generation alongside customer retention. Excluding integration costs from adjusted earnings cannot prove that the integration has paid for itself.
Each quarterly comparison should also show whether the combined business can grow without another major purchase. Insurance prices matter: catastrophe-property rates fell 13% year over year in the third quarter of 2026. A slowdown may reflect market pricing rather than weak selling, so organic growth should be read alongside customer wins and retention.