Brown & Brown dividend
MyStockButler's October 2026 analysis: Brown & Brown pays $0.18 quarterly today; the forecast gives $0.81, $0.93 and $1.05 per share, while the bear case holds the annual payment at $0.72 and the bull case reaches $1.32 by 2029. Brown & Brown returns some free cash flow through dividends and buybacks while retaining the majority, but acquisitions have required outside financing.
How much does Brown & Brown pay in dividends?
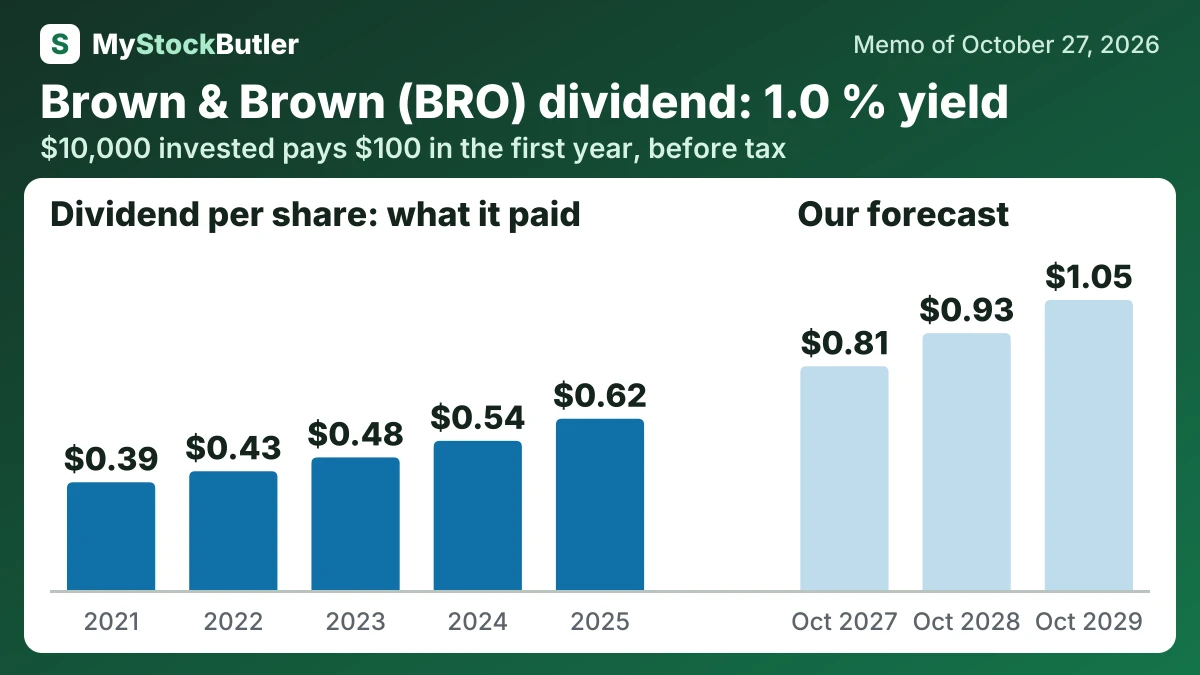
Dividends rise from the current $0.18 quarterly payment. The base case gives $0.81, $0.93 and $1.05 per share in the three forecast windows, using measured increases of $0.03 per quarter. The bear case holds the annual payment at $0.72, while the bull case reaches $1.32 by 2029. A rising dividend is supported by the record of increases from 2021 through 2025 and the low payout, but debt and integration spending make a pause plausible.
| October 2027 | October 2028 | October 2029 | |
|---|---|---|---|
| Earnings | 1,492 (1,287 / 1,623) | 1,622 (1,286 / 1,817) | 1,753 (1,284 / 2,036) |
| Shares (millions) | 327 (329 / 323) | 323 (327 / 316) | 319 (325 / 311) |
| Dividends per share | 0.81 (0.72 / 0.84) | 0.93 (0.72 / 1.08) | 1.05 (0.72 / 1.32) |
What this means. The numbers in brackets are the lower and higher estimates if the company does worse or better than expected.
How much would Brown & Brown's dividend pay you?
$10,000 invested in Brown & Brown at its 1.0% dividend yield (our report of October 27, 2026) pays $100.00 in the first year, before tax. If its dividend per share keeps changing 12.3% a year, as it did from 2021 to 2025, and the dividends are reinvested, year 10 pays $329.13, with $1,926.96 received in all.
Before tax. Past dividend growth is not a promise. Information only, not investment advice.
Does Brown & Brown's dividend come from free cash flow?
The company returned some free cash flow through dividends and buybacks, but retained the majority. In ordinary years, retained cash came much closer to covering acquisitions. The largest transactions, however, created a gap between internally generated cash and the price of the businesses purchased.
| 2025 | 2024 | 2023 | 2022 | 2021 | |
|---|---|---|---|---|---|
| Free cash flow | 1,382 | 1,092 | 941 | 829 | 763.8 |
| − Dividends paid | 193 | 154 | 135 | 120 | 107.2 |
| − Share buybacks | 100 | 0 | 0 | 74 | 82.6 |
| = Free cash flow not paid out | 1,085 | 938 | 806 | 635 | 574.0 |
| − Acquisitions | 7,854 | 890 | 631 | 1,928 | 366.8 |
| + Debt issued | 4,642 | 1,099 | 420 | 2,350 | 0 |
What this means. The company's own net debt differs because it counts only cash equivalents, not short-term investments, and its 2021 figure uses an older cash amount.
What could change Brown & Brown's dividend?
The forecast moves toward the bear case if renewal pricing and net new business remain weak through 2027–2029, or if integration costs exceed savings and retention falters during 2027–2028. Persistent leverage and limited cash generation in 2028–2029 would further restrict buybacks and compress the multiple.
What is Brown & Brown's dividend yield at today's price?
At today’s share price, Brown & Brown’s stock is a claim on both its earnings and the debt used to build the business.
| Today (Oct 27, 2026) | |
|---|---|
| Share price | 71.08 |
| Market value (calculated) | 23,576.66 |
| Enterprise value (calculated) | 30,236.66 |
| P/E, last 12 months (calculated) | 22.5x |
| Dividend yield (calculated) | 1.0% |
What this means. The market value includes shares held in an acquisition escrow, but the book value leaves those shares out, so the two figures use different share counts.