Broadridge earnings date and guidance
MyStockButler's October 2026 analysis: Broadridge will report results on November 3, 2026. Watch the conversion of sales into live services.
What has Broadridge guided for fiscal 2027?
Management guides to 6%–8% recurring-revenue growth and 8%–12% adjusted EPS growth for the year to June 2027. It targets a 21.0% adjusted operating margin and free-cash-flow conversion greater than 100%, with $290 million–$330 million of closed sales that still must become live client services.
| Period guided | Low | High | Date given | |
|---|---|---|---|---|
| Recurring revenue growth constant currency (Non-GAAP) | Year to Jun 2027 | 6.0% | 8.0% | Aug 4, 2026 |
| Adjusted Operating income margin (Non-GAAP) | Year to Jun 2027 | 21.0% | 21.0% | Aug 4, 2026 |
| Adjusted Earnings per share growth (Non-GAAP) | Year to Jun 2027 | 8.0% | 12.0% | Aug 4, 2026 |
| Free cash flow conversion (Non-GAAP) | Year to Jun 2027 | >100.0% | Aug 4, 2026 | |
| Closed sales | Year to Jun 2027 | 290 | 330 | Aug 4, 2026 |
What this means. A blank high value means the company expects free cash flow conversion to be more than 100 percent, with no stated upper limit.
Has Broadridge kept its past promises?
Management’s five-year record supports its recurring-revenue and adjusted-EPS promises more strongly than its closed-sales forecasts. All ten recurring-revenue and adjusted-EPS outcomes finished inside or above original guidance, while closed sales exceeded guidance twice, met it once and fell short twice.
| What management forecast | Checked | Above | Within | Below |
|---|---|---|---|---|
| Recurring revenue growth | 5 years | 2 | 3 | 0 |
| Adjusted Earnings per share growth - Non-GAAP | 5 years | 0 | 5 | 0 |
| Closed sales | 5 years | 2 | 1 | 2 |
What has Broadridge's revenue and profit done over the last eight quarters?
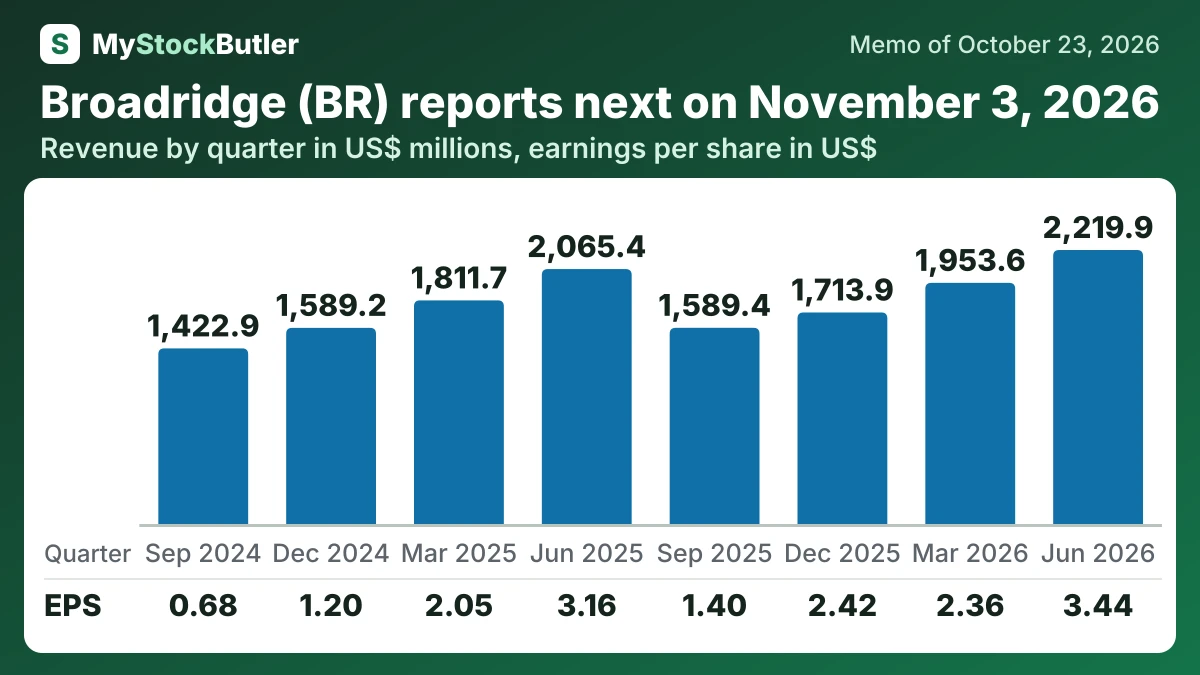
Compared with the same quarter a year earlier, revenue and operating income rose, while gross margin improved. The comparison is more useful than a comparison with March because Broadridge’s business follows the shareholder-meeting calendar and is seasonal.
The quarter’s digital-asset loss depressed reported net income and EPS. That is the reverse of the December 2025 quarter, when a large gain helped results. Reading the last eight quarters together keeps either movement from being mistaken for a sudden change in customer demand.
| Jun 2026 | Mar 2026 | Dec 2025 | Sep 2025 | Jun 2025 | Mar 2025 | Dec 2024 | Sep 2024 | |
|---|---|---|---|---|---|---|---|---|
| Revenue | 2,219.9 | 1,953.6 | 1,713.9 | 1,589.4 | 2,065.4 | 1,811.7 | 1,589.2 | 1,422.9 |
| Gross margin | 38.4% | 32.1% | 27.6% | 26.6% | 37.3% | 31.8% | 27.9% | 24.5% |
| Operating income | 546.2 | 359.5 | 206.0 | 188.8 | 498.6 | 344.9 | 210.7 | 134.4 |
| Net income | 398.0 | 276.3 | 284.6 | 165.4 | 374.2 | 243.1 | 142.4 | 79.8 |
| EPS, diluted | 3.44 | 2.36 | 2.42 | 1.40 | 3.16 | 2.05 | 1.20 | 0.68 |
| = Free cash flow | 645.3 | 287.5 | 318.5 | 27.1 | 684.1 | 348.9 | 227.9 | -133.4 |
What this means. The cash from operations and free cash flow figures cover only three months in each column, not the whole year, so they are not yearly totals.
What should I watch in Broadridge's next results?
Broadridge will report first-quarter fiscal 2027 results on November 3, 2026. Investors should watch recurring growth, the conversion of sales into live services and whether technology spending produces the expected progress. One quarter cannot settle the year, but it can expose delays.