Broadridge dividend: cash coverage and outlook
MyStockButler's October 2026 analysis: Broadridge pays $443.5 million in dividends from $1.233 billion of free cash flow. Broadridge’s cash covers that dividend, while the remaining cash also has to support repurchases, acquisitions, debt, and investment.
How much does Broadridge pay per share?
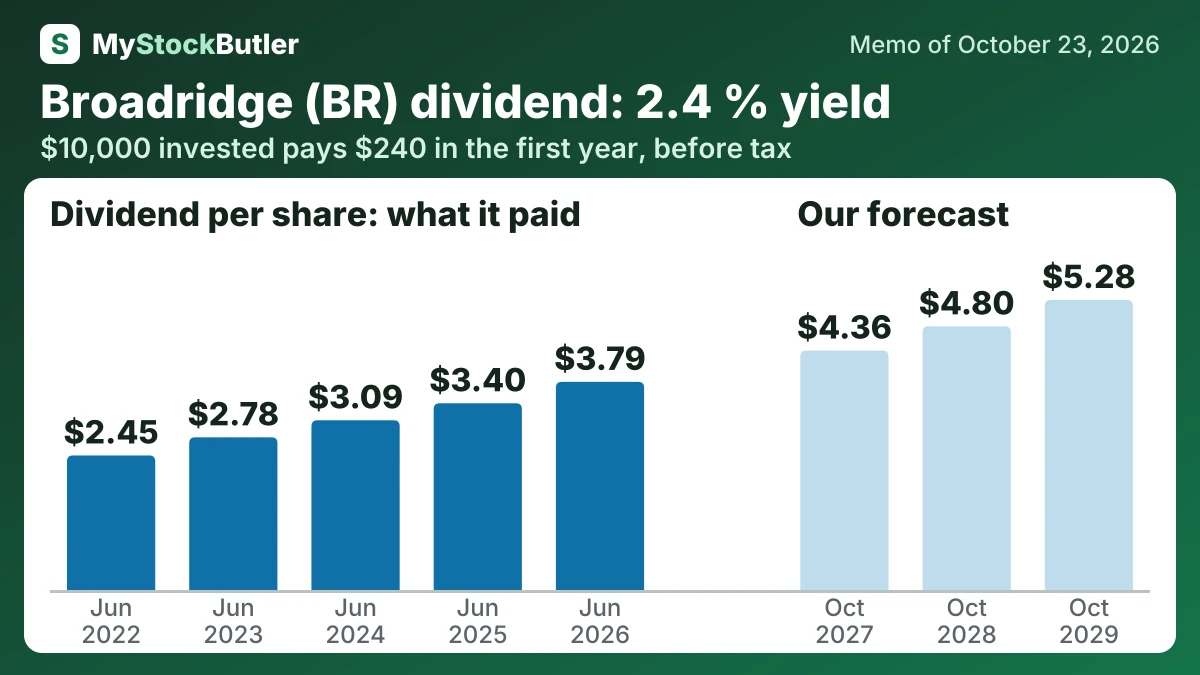
The dividend begins at $4.36 per share because that is management’s stated FY2027 annual amount. The base case grows it by 10% annually to $4.80 and then $5.28. The bear case holds it at $4.36, while the bull case grows it by 12% to $4.88 and then $5.47.
| October 2027 | October 2028 | October 2029 | |
|---|---|---|---|
| Earnings | 1,222 (1,161 / 1,259) | 1,345 (1,219 / 1,430) | 1,481 (1,289 / 1,616) |
| Shares (millions) | 111 (112 / 109) | 109 (112 / 106) | 107 (111 / 103) |
| Dividends per share | 4.36 (4.36 / 4.36) | 4.80 (4.36 / 4.88) | 5.28 (4.36 / 5.47) |
| Price to earnings | 17.00 (13.00 / 20.00) | 17.50 (12.00 / 22.00) | 18.00 (11.00 / 24.00) |
How much would Broadridge's dividend pay you?
$10,000 invested in Broadridge at its 2.4% dividend yield (our report of October 23, 2026) pays $240.00 in the first year, before tax. If its dividend per share keeps changing 11.5% a year, as it did from Jun 2022 to Jun 2026, and the dividends are reinvested, year 10 pays $900.35, with $4,957.10 received in all.
Before tax. Past dividend growth is not a promise. Information only, not investment advice.
Is Broadridge’s dividend covered by its cash?
Free cash flow is operating cash after capital expenditure and software purchases. In FY26, Broadridge generated $1.233 billion against $443.5 million of dividends, leaving cash for repurchases, acquisitions, debt, and investment.
Shareholder distributions became the sharpest choice. Dividends and buybacks absorbed 81.6% of fiscal 2026 free cash flow. On August 3, 2026, the board authorised another $1.5 billion of repurchases and raised the quarterly dividend to $1.09. An authorisation permits purchases; it is not money already spent. The economic test depends on whether Broadridge buys shares below the value of the future cash those shares can earn.
| Jun 2026 | Jun 2025 | Jun 2024 | Jun 2023 | Jun 2022 | |
|---|---|---|---|---|---|
| Free cash flow | 1,278.4 | 1,127.5 | 998.8 | 784.9 | 414.5 |
| − Dividends paid | 443.5 | 402.3 | 368.2 | 331.0 | 290.7 |
| − Share buybacks | 600 | 100 | 450 | 0 | 0 |
| = Free cash flow not paid out | 234.9 | 625.2 | 180.6 | 453.9 | 123.8 |
What this means. “Investments bought” is a combined net amount, so it may include other investing activity and is not the company’s total investment purchases.
What could change Broadridge’s dividend?
The November 3, 2026 results test recurring growth, go-live conversion and technology spending. Backlog conversion, 98% recurring-fee retention and onboarding costs will show whether signed business earns attractive fees. The SEC’s electronic-delivery proposal remained pending on October 23, 2026. Digital-market adoption and cash generation after investment will decide whether new platforms support dividends alongside repurchases.
What is Broadridge’s dividend yield today?
| Today (Oct 23, 2026) | |
|---|---|
| Share price | 183.77 |
| Free cash flow yield (calculated) | 6.2% |
| Real free cash flow yield (calculated) | 5.7% |
| Dividend yield (calculated) | 2.4% |
What this means. Enterprise value is higher than market value because it adds the company's debt and subtracts its cash, showing what it would cost to buy the whole business.