APA earnings: guidance and results
MyStockButler's October 2026 analysis: APA's next results are expected on November 4, 2026. Watch whether cost savings become durable cash while old liabilities remain controlled.
What has APA guided for the year?
August guidance sets 2026 capital and production targets. The table separates reported production from adjusted production and shows the company and U.S. measures across the full year and third quarter. “Barrels of oil equivalent,” or BOE, converts gas into an energy comparison; APA uses a 6-to-1 gas-to-oil-equivalent ratio, but that does not mean gas earns the price of oil. Reported production includes field output, while adjusted production removes Egypt’s minority interest and barrels attributed to Egyptian income taxes. The two figures therefore answer different questions.
The savings promise is a US$500 million annual run rate by year-end 2026. A run rate is the annual cost improvement implied by the year-end structure, not the amount saved during the whole year. The test is whether cheaper wells, more efficient field operations and corporate streamlining reduce recurring cash costs after implementation charges.
| Period guided | Low | High | Date given | |
|---|---|---|---|---|
| Total Company Adjusted — Oil (thousand bbl/day) — FY 2026 | Year to Dec 2026 | 179 | 179 | Aug 5, 2026 |
| Total Company Adjusted — BOE (thousand boe/day) — FY 2026 | Year to Dec 2026 | 361 | 361 | Aug 5, 2026 |
| U.S. — Oil (thousand bbl/day) — FY 2026 | Year to Dec 2026 | 123 | 123 | Aug 5, 2026 |
| U.S. — BOE (thousand boe/day) — FY 2026 | Year to Dec 2026 | 272 | 272 | Aug 5, 2026 |
| Upstream Capital Investment — FY 2026 | Year to Dec 2026 | 2,070 | 2,070 | Aug 5, 2026 |
| Run-rate savings | Year to Dec 2026 | 500 | 500 | Aug 5, 2026 |
What this means. Reported production is higher than adjusted production because it includes Egypt’s minority-owned production and barrels taken instead of taxes, while adjusted production leaves those out.
Has APA kept its past promises?
APA reached a $350 million annualized savings pace by year-end 2025 and raised the expected pace to $500 million in August 2026. An annualized pace is not the same as cash saved evenly throughout a year; it is the yearly result implied by the cost structure at a particular date. APA also reported $752 million of debt repayment during the first half of 2026.
What is APA's recent revenue and profit trend?
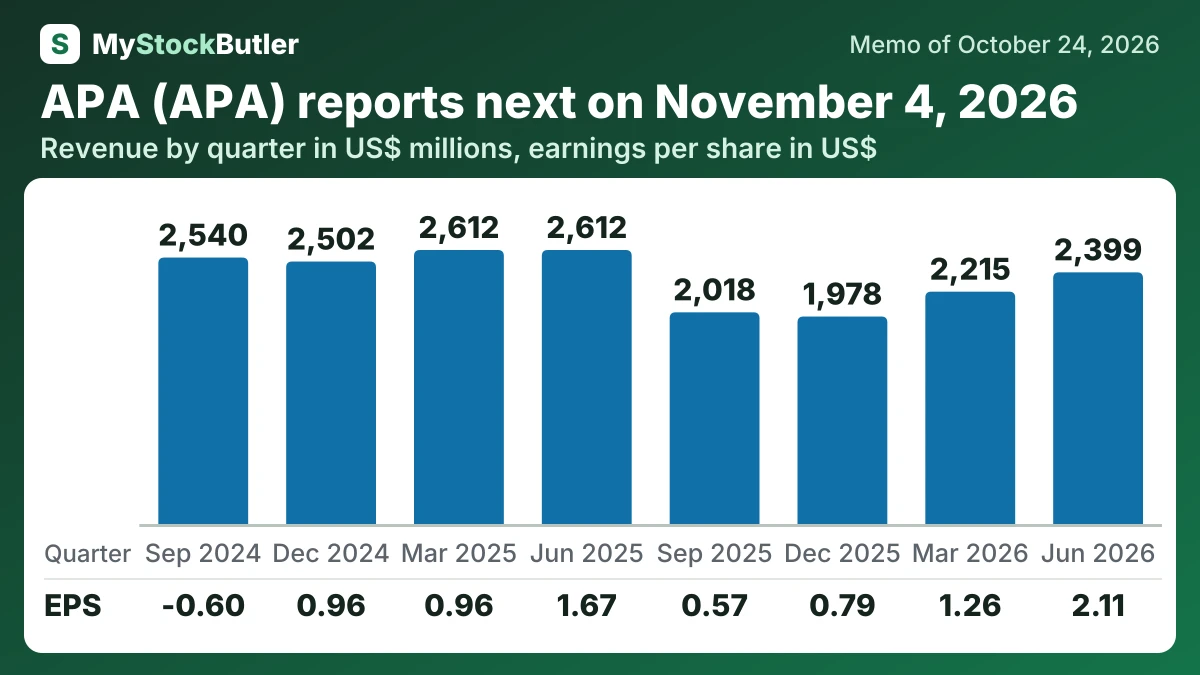
Revenue declined, but operating income, net income and diluted EPS increased. The comparison is blurred because revenue includes purchased products, derivatives and asset-sale effects. The prior-year quarter also included a substantial divestiture gain.
| Jun 2026 | Mar 2026 | Dec 2025 | Sep 2025 | Jun 2025 | Mar 2025 | Dec 2024 | Sep 2024 | |
|---|---|---|---|---|---|---|---|---|
| Revenue | 2,399 | 2,215 | 1,978 | 2,018 | 2,612 | 2,612 | 2,502 | 2,540 |
| Operating income | 1,335 | 887 | 547 | 557 | 1,094 | 706 | 591 | -240 |
| Net income | 747 | 446 | 279 | 205 | 603 | 347 | 354 | -223 |
| EPS, diluted | 2.11 | 1.26 | 0.79 | 0.57 | 1.67 | 0.96 | 0.96 | -0.60 |
What this means. The cash from operations and capital spending numbers cover only three months, even though their descriptions say “during the year,” so they are not yearly totals.
What should I watch in APA's next results?
The first checkpoint is the November 5, 2026, third-quarter results call. Investors should compare production and spending with August guidance, then reconcile operating cash, trading gains, compensation expense and repurchases. Year-end will test the savings run rate and shareholder-return promise, while the 2027 planning cycle should show how much cash remains for exploration after core-field spending.