APA stock forecast 2027–2029
MyStockButler's October 2026 analysis: APA's weighted price is $46.09 in October 2027, $56.45 in October 2028 and $75.51 by October 2029. It hinges on durable cash generation and successful GranMorgu delivery.
Where could APA's shares be by 2029?
The forecast's weighted price is $46.09 in October 2027, a 9% loss including dividends. It rises to $56.45 in October 2028, a 12% gain. By October 2029, it reaches $75.51, a 51% gain.
The October 2029 range runs from $26.51 in the bear case to $156.04 in the bull case. Today's reference price is $51.90. The bear probability is 30%, the base probability is 55%, and the bull probability is 15%.
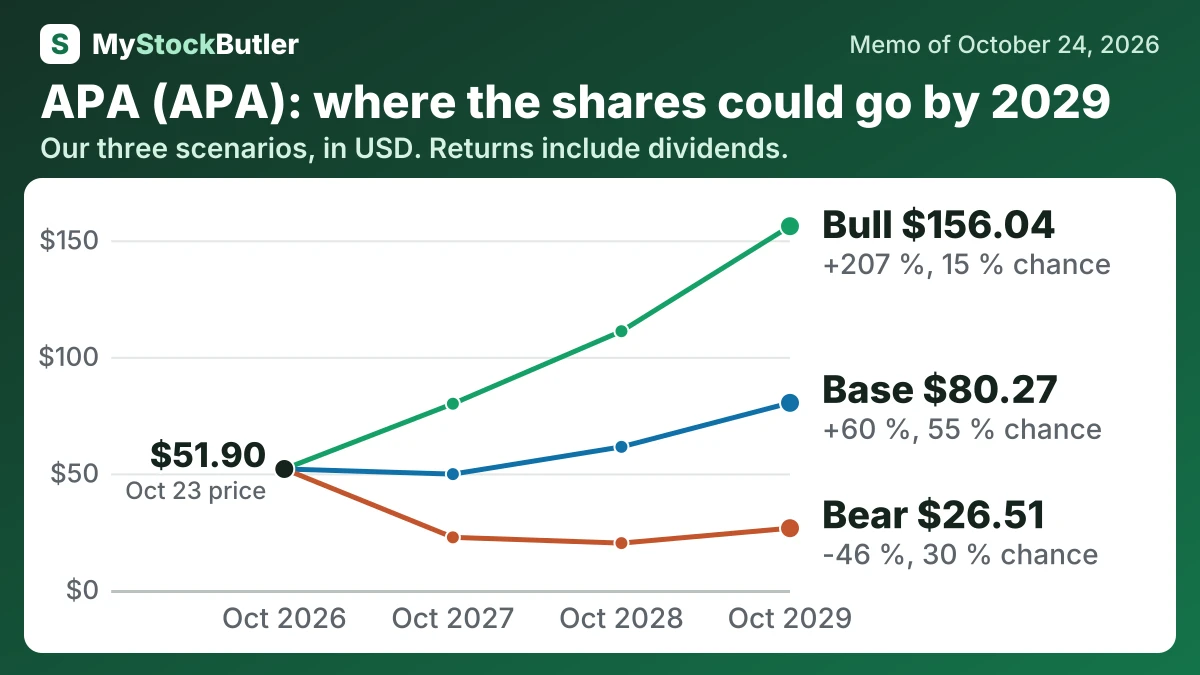
| Case | Probability | October 2027 | October 2028 | October 2029 |
|---|---|---|---|---|
| Bear | 30 % | 22.58 (-55 %) | 20.11 (-59 %) | 26.51 (-46 %) |
| Base | 55 % | 49.70 (-2 %) | 61.40 (+22 %) | 80.27 (+60 %) |
| Bull | 15 % | 79.89 (+56 %) | 111.00 (+118 %) | 156.04 (+207 %) |
| Weighted | 100 % | 46.09 (-9 %) | 56.45 (+12 %) | 75.51 (+51 %) |
What this means. The weighted row is the probability-based average of the bear, base, and bull cases, not a separate prediction.
What has to go right for APA's base case?
EBITDA is the central operating judgement. The base path rises from $5,100 million to $5,300 million, then reaches $5,900 million. It starts near APA's $5,359 million 2025 adjusted EBITDAX, but normalizes the strong 2026 outlook while adding savings and lower costs. The bear path falls from $3,800 million to $3,600 million before recovering to $3,900 million, reflecting weaker prices, production decline and project pressure. The bull path rises from $6,200 million to $6,900 million and then $7,900 million, requiring strong realizations, durable savings and timely GranMorgu contribution.
| October 2027 | October 2028 | October 2029 | |
|---|---|---|---|
| EBITDA | 5,100 (3,800 / 6,200) | 5,300 (3,600 / 6,900) | 5,900 (3,900 / 7,900) |
| Shares (millions) | 331 (342 / 322) | 323 (344 / 304) | 317 (347 / 285) |
| Dividends per share | 1.00 (0.75 / 1.00) | 1.00 (0.50 / 1.10) | 1.00 (0.50 / 1.20) |
| Enterprise value to ebitda | 3.70 (2.80 / 4.50) | 4.00 (2.60 / 5.00) | 4.30 (2.80 / 5.50) |
| Net debt | 2,415 (2,920 / 2,190) | 1,375 (2,440 / 810) | -60.00 (1,730 / -1,020) |
What this means. A negative net debt number means the company has more cash than borrowed money.
How much cash does APA really make?
Cash from operations exceeded capital spending by a substantial amount, even after allowing for stock pay. Stock compensation is not an immediate cash cost, but it transfers value to employees through dilution or future repurchases, so treating it as an ownership cost is sensible.
| 2025 | 2024 | 2023 | 2022 | 2021 | |
|---|---|---|---|---|---|
| Cash from operations | 4,545 | 3,620 | 3,129 | 4,943 | 3,496 |
| − Capital spending | 2,740 | 2,851 | 2,313 | 1,770 | 1,101 |
| = Free cash flow | 1,805 | 769 | 816 | 3,173 | 2,395 |
| − Stock pay | 107 | 49 | 84 | 304 | 157 |
| = Real free cash flow | 1,698 | 720 | 732 | 2,869 | 2,238 |
What this means. The company's free cash flow number differs from ours because it adds back some cash items in some years and subtracts extra cash in others; our count treats those cash items consistently.
What does an investor pay for APA today?
APA’s price-to-earnings ratio, or P/E, compares the share price with earnings per share. Its trailing P/E was 10.97x and its forward P/E was 10.04x. That does not make the stock obviously cheap, because a temporary rise in oil prices can inflate the earnings denominator. APA’s $1.1 billion of impairments in 2024 also shows how sharply accounting earnings can change when asset values are revised.