A. O. Smith stock forecast 2027–2029
MyStockButler's November 2026 analysis: A. O. Smith's weighted price is $59.17 in November 2027, a 4% total loss including dividends, and reaches $69.46 in November 2029, an 18% total return. It hinges on pricing, inflation, boilers, Leonard and treatment working together.
Where could A. O. Smith's shares be by November 2029?
The weighted path points to a modest near-term decline, followed by recovery. The weighted price is $59.17 in November 2027, a 4% total loss including dividends. It rises to $64.12 in November 2028, a 7% total return. By November 2029, it reaches $69.46, an 18% total return.
The bear-to-bull range by November 2029 is $40.97 to $97.06. Today’s price is $63.07. The bear case receives 27% probability. The base case receives 53%. The bull case receives 20%.
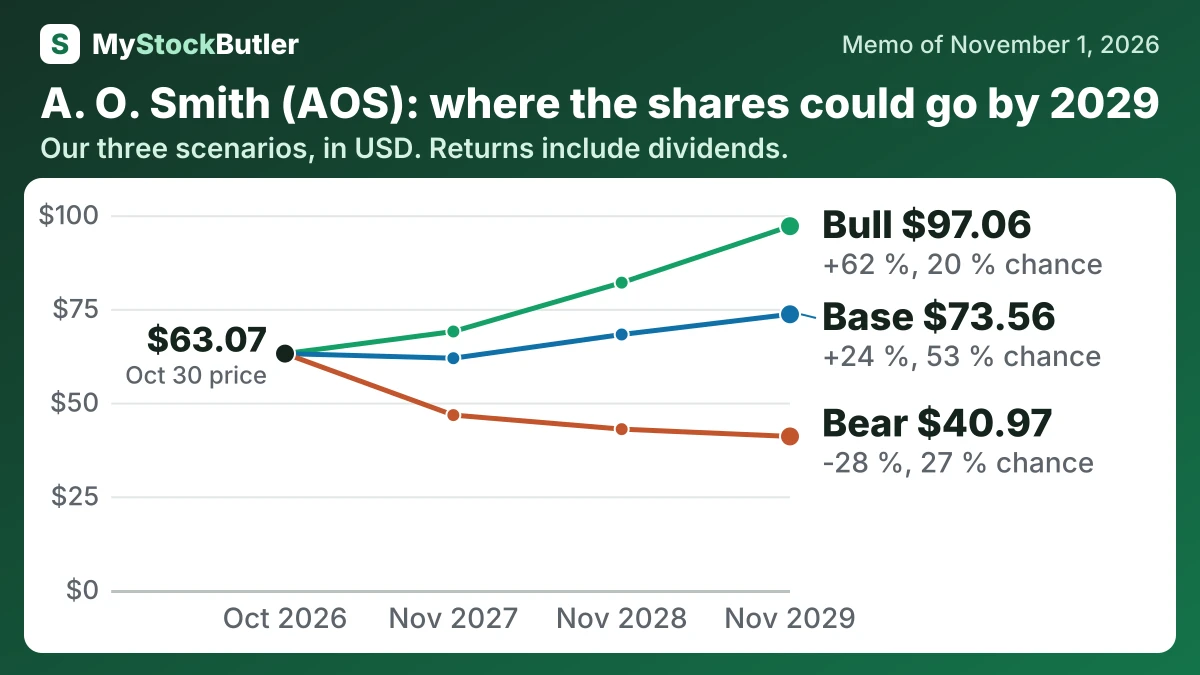
| Case | Probability | November 2027 | November 2028 | November 2029 |
|---|---|---|---|---|
| Bear | 27 % | 46.66 (-24 %) | 42.91 (-27 %) | 40.97 (-28 %) |
| Base | 53 % | 61.84 (+0 %) | 68.17 (+13 %) | 73.56 (+24 %) |
| Bull | 20 % | 68.97 (+12 %) | 82.00 (+35 %) | 97.06 (+62 %) |
| Weighted | 100 % | 59.17 (-4 %) | 64.12 (+7 %) | 69.46 (+18 %) |
What has to go right or wrong for A. O. Smith?
The bear case gives $438.8 million in 2027 and $426.4 million in 2028. It recovers only to $432.9 million in 2029. This reflects weak residential demand, incomplete price recovery and a slow treatment turnaround. The bull case gives $516.8 million in 2027 and $556.9 million in 2028. It reaches $600.0 million in 2029 if pricing sticks, inflation moderates and treatment savings arrive. The latest North American margin decline and mixed guidance record support the downside risk, while treatment savings and established replacement demand support the upside.
| November 2027 | November 2028 | November 2029 | |
|---|---|---|---|
| Earnings | 489 (439 / 517) | 516 (426 / 557) | 542 (433 / 600) |
| Shares (millions) | 129 (132 / 127) | 125 (129 / 122) | 121 (127 / 117) |
| Dividends per share | 1.52 (1.52 / 1.60) | 1.61 (1.52 / 1.70) | 1.71 (1.37 / 1.81) |
| Price to earnings | 16.30 (14.00 / 17.00) | 16.50 (13.00 / 18.00) | 16.50 (12.00 / 19.00) |
How much cash does A. O. Smith really make?
Stock compensation is another analytical adjustment. The company recorded $13.8 million of stock compensation in 2025. Subtracting it from free cash flow gives an estimated $532.2 million, or 13.9% of revenue. That is not an extra cash payment already made, but it recognizes dilution to existing owners.
| 2025 | 2024 | 2023 | 2022 | 2021 | |
|---|---|---|---|---|---|
| Cash from operations | 616.8 | 581.8 | 670.3 | 391.4 | 641.1 |
| − Capital spending | 70.8 | 108.0 | 72.6 | 70.3 | 75.1 |
| = Free cash flow | 546.0 | 473.8 | 597.7 | 321.1 | 566.0 |
| − Stock pay | 13.8 | 14.9 | 11.5 | 11.1 | 11.9 |
| = Real free cash flow | 532.2 | 458.9 | 586.2 | 310.0 | 554.1 |
| Real free cash flow, % of revenue | 13.9% | 12.0% | 15.2% | 8.3% | 15.7% |
What this means. The company's own free cash flow matches our count, but real free cash flow is lower because paying employees with shares gives away part of the company even though no cash leaves today.
What does an investor pay for A. O. Smith today?
The trailing P/E is 17.6 times and the forward P/E is 16.3 times. P/E means the share price paid for each dollar of annual earnings. The trailing figure includes China and recent unusual items; the forward figure depends on an estimate whose treatment of China is not clear. On management’s ex-China adjusted EPS midpoint of $3.47, the shares trade at about 18.2 times earnings.