Akamai Technologies stock forecast 2027–2029
MyStockButler's October 2026 analysis: Akamai Technologies' weighted scenario is a rising path through October 2029. It hinges on turning cloud capacity into profitable cash generation.
Where could Akamai Technologies' shares be by October 2029?
The range is much wider than the weighted result. By October 2029, the bear case gives $50.33 while the bull case gives $370.85. The bear gets 35% probability and the base gets 50%. The bull receives the remaining 15%.
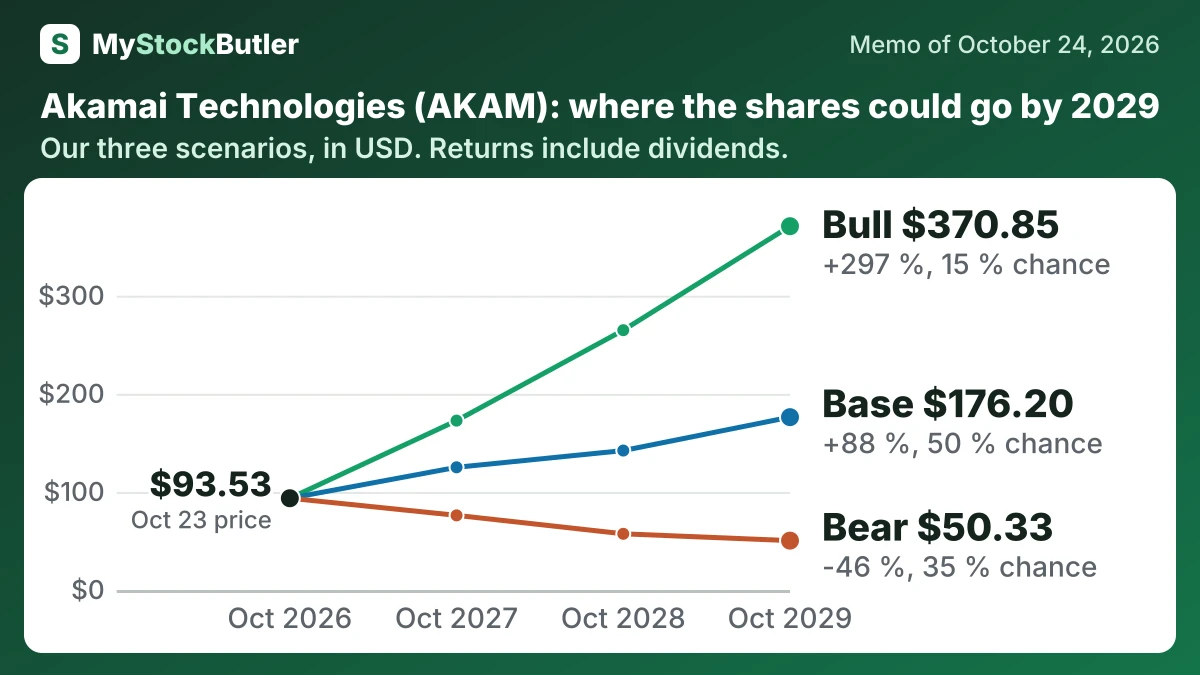
| Case | Probability | October 2027 | October 2028 | October 2029 |
|---|---|---|---|---|
| Bear | 35 % | 76.07 (-19 %) | 57.27 (-39 %) | 50.33 (-46 %) |
| Base | 50 % | 125.08 (+34 %) | 142.14 (+52 %) | 176.20 (+88 %) |
| Bull | 15 % | 172.65 (+85 %) | 264.86 (+183 %) | 370.85 (+297 %) |
| Weighted | 100 % | 115.06 (+23 %) | 130.84 (+40 %) | 161.34 (+73 %) |
What has to go right or wrong for Akamai Technologies?
The bear case gives EBITDA of $1,921 million in 2027 and $2,052 million in 2029, with $1,950 million between them. Revenue grows more slowly and margins fall from 39.2% to 37.3% because delivery declines, cloud utilization disappoints and costs remain high. The bull case rises from $2,279 million to $3,353 million, with $2,800 million in 2028. Its margins expand from 42.6% to 44.7% as security growth and fuller capacity offset delivery pressure.
How much cash does Akamai Technologies really make?
Stock compensation creates a second economic bridge. Subtracting $459.4 million from conventional free cash flow leaves analytical “real free cash flow” of $239.9 million in 2025. This is not another cash payment; it estimates the cost shareholders bear through dilution.
| 2025 | 2024 | 2023 | 2022 | 2021 | |
|---|---|---|---|---|---|
| Cash from operations | 1,518,765 | 1,519,171 | 1,348,439 | 1,274,676 | 1,404,563 |
| − Capital spending | 819,500 | 685,267 | 730,040 | 458,302 | 545,230 |
| = Free cash flow | 699,265 | 833,904 | 618,399 | 816,374 | 859,333 |
| − Stock pay | 459,402 | 393,378 | 328,467 | 217,185 | 202,759 |
| = Real free cash flow | 239,863 | 440,526 | 289,932 | 599,189 | 656,574 |
What this means. Real free cash flow is lower because we subtract shares given to employees as pay, since they give away part of the company even though no cash leaves immediately.
What does an investor pay for Akamai Technologies today?
Over five years, revenue grew while operating margin and the memo’s calculated real free cash flow margin weakened. Security and cloud replaced delivery’s lost sales, but the figures do not establish that they replaced its profit contribution. Net debt rose as Akamai funded acquisitions and infrastructure; 2025 diluted EPS was $3.07 against $1.63 of real free cash flow per share. At $93.53, shares trade at 33.6x trailing earnings and offer a 5.2% free cash flow yield. The 1.8% real yield subtracts stock pay.
| Today (Oct 24, 2026) | |
|---|---|
| Share price | 93.53 |
| P/E, last 12 months (calculated) | 33.6x |
| Free cash flow yield (calculated) | 5.2% |
| Real free cash flow yield (calculated) | 1.8% |
What this means. The next twelve months price-to-earnings ratio uses analysts’ expected profit, so it is a forecast and may not match what the company actually earns.