Akamai Technologies earnings
MyStockButler's October 2026 analysis: Akamai Technologies' next results are expected on November 5, 2026. Akamai Technologies should watch whether purchased equipment becomes operating, billable capacity on schedule.
What has Akamai Technologies guided for 2026?
Management guides to 2026 revenue of $4,445 million–$4,530 million. It targets non-GAAP diluted EPS of $6.40–$7.05. The expanded Anthropic commitment is expected to deliver $150 million–$300 million of 2027 revenue. Management’s compute ambition is approximately 20% CAGR, the average yearly growth rate.
That distinction matters in the September 2026 quarter. Annual revenue guidance stayed unchanged after the Anthropic announcement, but planned 2026 capital spending rose by $1.7 billion. Purchases therefore begin before the additional sales.
| Period guided | Low | High | Date given | |
|---|---|---|---|---|
| Revenue (in millions) | Year to Dec 2026 | 4,445 | 4,530 | Aug 6, 2026 |
| Revenue (in millions) | Quarter to Sep 2026 | 1,105 | 1,130 | Aug 6, 2026 |
| Non-GAAP net income per diluted share | Year to Dec 2026 | 6.40 | 7.05 | Aug 6, 2026 |
| Non-GAAP net income per diluted share | Quarter to Sep 2026 | 1.60 | 1.80 | Aug 6, 2026 |
| Increase in capital expenditures (in billions) | Year to Dec 2026 | 1.7 | 1.7 | Sep 24, 2026 |
| Revenue Delivery (in millions) | Year to Dec 2027 | 150 | 300 | Sep 24, 2026 |
What this means. The $3.1 billion capital spending figure is only for the Anthropic commitment, not all of the company’s capital spending, and the $150 million to $300 million revenue estimate begins in late spring 2027.
Has Akamai Technologies kept its promises?
Management’s quarterly record is strong: every comparable observation in the seven-quarter, three-measure series met or exceeded initial guidance. But the annual outlook became less profitable between February and August, so execution has been good while the cost of expansion has become clearer.
| What management forecast | Checked | Above | Within | Below |
|---|---|---|---|---|
| Revenue (in millions) | 7 quarters | 3 | 4 | 0 |
| Non-GAAP operating margin | 7 quarters | 4 | 3 | 0 |
| Non-GAAP net income per diluted share | 7 quarters | 4 | 3 | 0 |
What this means. The company's adjusted net income per diluted share cannot be fairly compared with its standard accounting result because the company says the numbers cannot be reconciled without unreasonable effort.
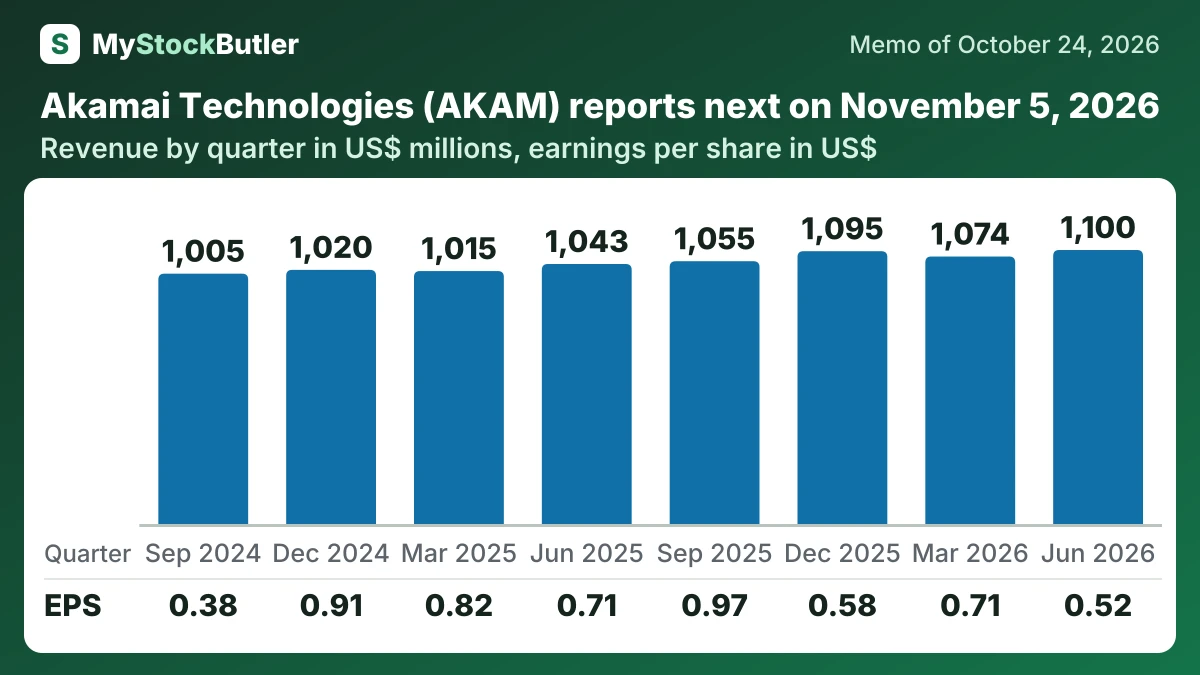
What do Akamai Technologies' last eight quarters show?
Profit moved in the opposite direction. Operating income fell from $151.5 million to $80.3 million between the comparable quarters. Gross margin fell from 59.1% to 55.8%, and operating margin reached 7.3%. Restructuring was too small to explain the decline; excluding it from both periods still leaves operating income down about 46.9%.
Cash confirmed the pressure. Cash from operations fell from $459.1 million to $326.3 million, while capital spending rose slightly from $223.8 million to $225.8 million. Free cash flow consequently fell from $235.4 million to $100.5 million. The first-half comparison also showed less cash remaining after investment.
| Jun 2026 | Mar 2026 | Dec 2025 | Sep 2025 | Jun 2025 | Mar 2025 | Dec 2024 | Sep 2024 | |
|---|---|---|---|---|---|---|---|---|
| Revenue | 1,099,682 | 1,073,610 | 1,094,912 | 1,054,630 | 1,043,494 | 1,015,139 | 1,019,939 | 1,004,679 |
| Gross margin | 55.8% | 56.1% | 58.7% | 59.3% | 59.1% | 58.7% | 59.4% | 59.3% |
| Operating income | 80,284 | 114,494 | 94,876 | 166,024 | 151,461 | 154,583 | 148,060 | 70,637 |
| Net income | 79,404 | 106,319 | 85,072 | 140,170 | 103,618 | 123,171 | 139,905 | 57,907 |
| EPS, diluted | 0.52 | 0.71 | 0.58 | 0.97 | 0.71 | 0.82 | 0.91 | 0.38 |
| = Free cash flow | 100,513 | 120,661 | 161,889 | 246,816 | 235,368 | 55,192 | 180,929 | 207,425 |
What this means. These figures are for each three-month quarter, even though some row descriptions say “during the year.”