Airbus stock forecast 2027–2029
MyStockButler's October 2026 analysis: The weighted scenario is €259.32 at October 2029, implying a 39% return including dividends. It hinges on Airbus converting its backlog into deliveries and cash while sustaining earnings.
Where could Airbus's shares be by October 2029?
At the first forecast point, the weighted price is €205.78, implying a 7% return including dividends. That point is October 2027. At the final point, the weighted price is €259.32, implying a 39% return including dividends. That point is October 2029. The bear case has a 30% probability. The base case has 52%; the bull case has 18%.
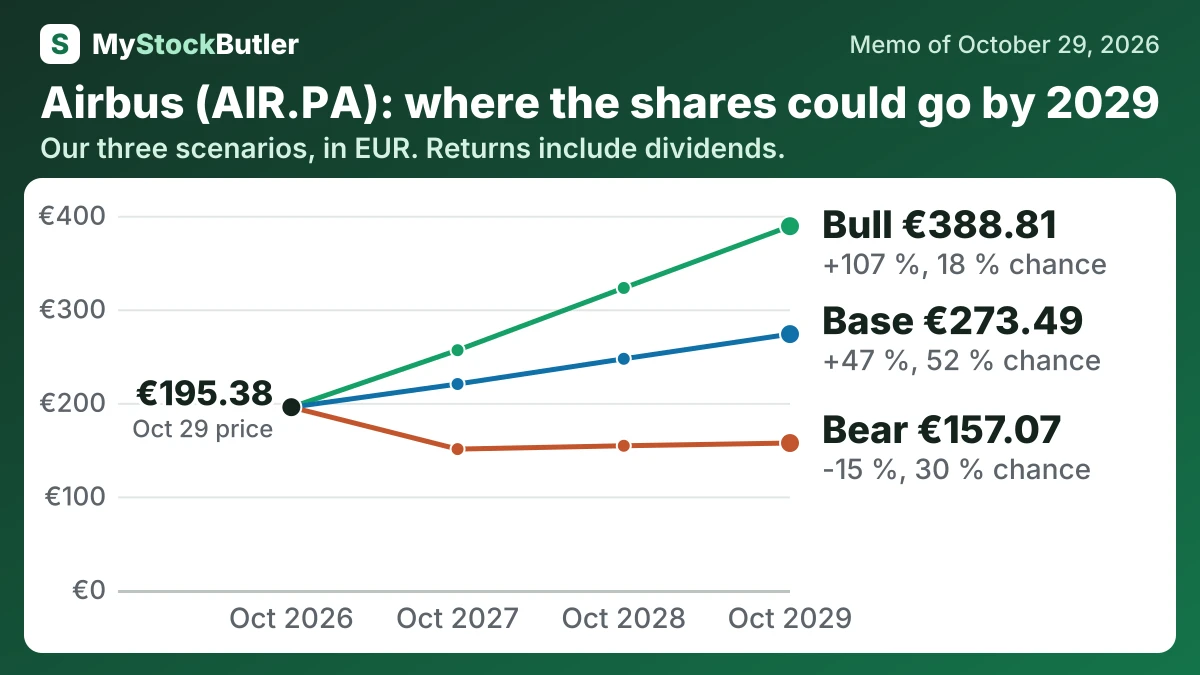
| Case | Probability | October 2027 | October 2028 | October 2029 |
|---|---|---|---|---|
| Bear | 30 % | 150.59 (-21 %) | 154.15 (-18 %) | 157.07 (-15 %) |
| Base | 52 % | 220.14 (+15 %) | 247.09 (+31 %) | 273.49 (+47 %) |
| Bull | 18 % | 256.28 (+33 %) | 322.81 (+70 %) | 388.81 (+107 %) |
| Weighted | 100 % | 205.78 (+7 %) | 232.84 (+23 %) | 259.32 (+39 %) |
What has to go right or wrong for Airbus?
The base assumes steady backlog conversion, services growth and improving margins. Airbus reported €4.55 billion in operating income for the first nine months, while management retained a €7.5 billion adjusted EBIT target for 2026; the measures are not identical, so the forecast remains below the longer-term adjusted ambition. The bear case reflects delivery setbacks and programme charges. The bull case assumes faster supplier recovery and better factory utilisation.
How much cash does Airbus really make?
In 2025 Airbus generated €7.995 billion from operations. After capital spending and lease payments, the table’s free-cash-flow calculation was €3.731 billion; after stock pay, its analytical “real” free cash flow was €3.372 billion. Stock pay is not a cash payment of that amount, but treating it as a cost recognises dilution borne by shareholders.
| 2025 | 2024 | 2023 | 2022 | 2021 | |
|---|---|---|---|---|---|
| Cash from operations | 7,995 | 7,402 | 6,255 | 6,288 | 4,639 |
| − Capital spending | 3,964 | 3,669 | 3,051 | 2,464 | 1,928 |
| − Lease payments | 300 | 324 | 267 | 262 | 400 |
| = Free cash flow | 3,731 | 3,409 | 2,937 | 3,562 | 2,311 |
| − Stock pay | 359 | 350 | 190 | 131 | 85 |
| = Real free cash flow | 3,372 | 3,059 | 2,747 | 3,431 | 2,226 |
What does an investor pay for Airbus today?
At €195.38 a share, the trailing P/E is 25.0. P/E means the share price divided by earnings per share: an investor is paying €25 for each €1 Airbus earned over the latest twelve months. If one share had earned €8, its P/E would be about 24.4. A forward P/E replaces past earnings with an estimate, so it describes expected profit rather than money already earned.
| Today (Oct 29, 2026) | |
|---|---|
| Share price | 195.38 |
| Enterprise value (calculated) | 154,552.41 |
| P/E, last 12 months (calculated) | 25.0x |
| P/E, next 12 months (calculated) | 22.5x |
| Free cash flow yield (calculated) | 2.4% |
| Real free cash flow yield (calculated) | 2.2% |