AbbVie vs Amgen stock: the numbers side by side (October 2026)
How do AbbVie and Amgen compare?
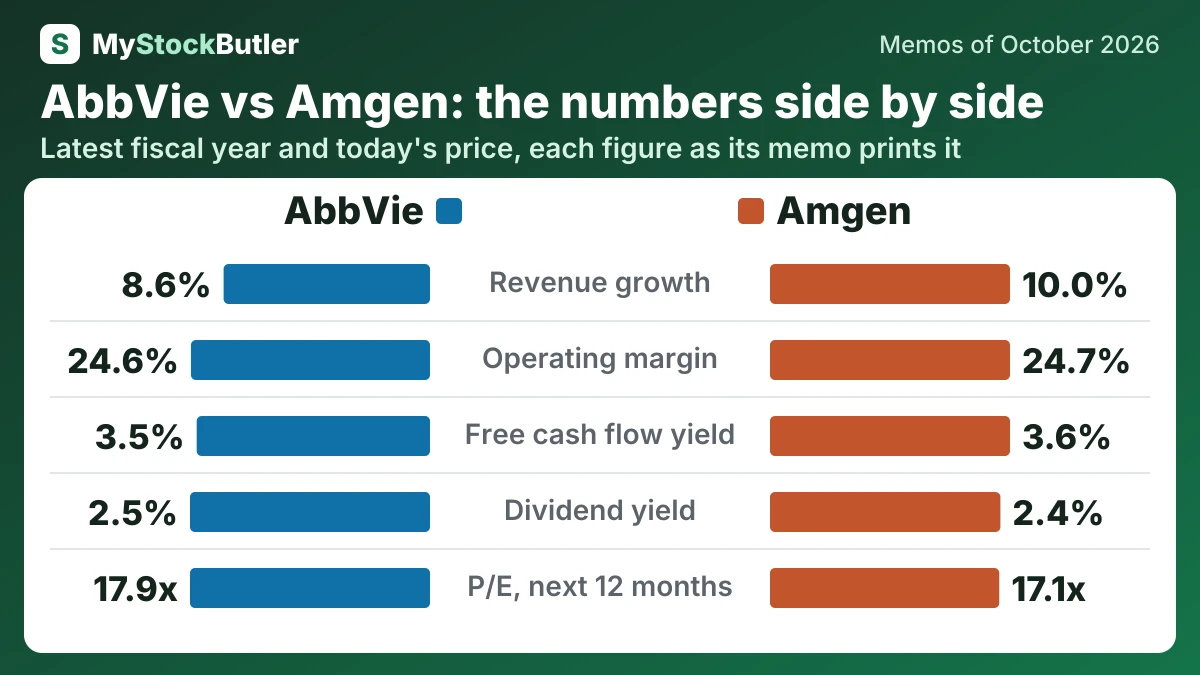
| AbbVie ABBV | Amgen AMGN | |
|---|---|---|
| Revenue growth | 8.6%2025 | 10.0%2025 |
| Operating margin | 24.6%2025 | 24.7%2025 |
| Free cash flow | 17,816US$ millions · 2025 | 8,100US$ millions · 2025 |
| Free cash flow yield | 3.5%Today (Oct 30, 2026) | 3.6%Today (Oct 12, 2026) |
| Dividend yield | 2.5%Today (Oct 30, 2026) | 2.4%Today (Oct 12, 2026) |
| P/E, last 12 months | 50.1xToday (Oct 30, 2026) | 26.0xToday (Oct 12, 2026) |
| P/E, next 12 months | 17.9xToday (Oct 30, 2026) | 17.1xToday (Oct 12, 2026) |
| Weighted price forecast, about 1 year | 285.67 (+1 %)October 2027 | 519.76 (+27 %)October 2027 |
| Weighted price forecast, about 3 years | 311.73 (+15 %)October 2029 | 548.42 (+39 %)October 2029 |
Who leads on what?
| Leads | The lead is | |
|---|---|---|
| Revenue growth | Amgen | The higher figure |
| Operating margin | Amgen | The higher figure |
| Free cash flow | AbbVie | The higher figure |
| Free cash flow yield | Amgen | The higher figure |
| Dividend yield | AbbVie | The higher figure |
| P/E, last 12 months | Amgen | The lower figure |
| P/E, next 12 months | Amgen | The lower figure |
| Weighted price forecast, about 1 year | Amgen | The higher weighted return |
| Weighted price forecast, about 3 years | Amgen | The higher weighted return |
What does each company do?
AbbVie sells prescription medicines in immunology, neuroscience and oncology, along with medical-aesthetics products such as Botox Cosmetic and Juvéderm.
AbbVie (ABBV), from our memo of October 30, 2026 · AbbVie stock forecast
Amgen develops, makes and sells prescription medicines for bone, cardiovascular, inflammatory, cancer, rare-disease and other conditions.
Amgen (AMGN), from our memo of October 13, 2026 · Amgen stock forecast
How fast are AbbVie and Amgen growing, and what did their latest results show?
AbbVie’s revenue grew 8.6% in 2025; Amgen’s grew 10.0% in 2025.
The latest quarter confirms continued sales progress, but its earnings growth is amplified by a weak comparison.
AbbVie (ABBV), from our memo of October 30, 2026 · AbbVie earnings
Revenue reached $10,054 million, up 9.5% from Q2 2025. Product sales grew 9%, with volume up 9% in the United States and 8% elsewhere. That broad improvement outweighed declines in older medicines.
Amgen (AMGN), from our memo of October 13, 2026 · Amgen earnings
How much cash do AbbVie and Amgen generate, and where does it go?
AbbVie’s free cash flow was US$17,816 million in 2025; Amgen’s was US$8,100 million in 2025. At AbbVie, the dividend yield was 2.5% on October 30, 2026; at Amgen, it was 2.4% on October 12, 2026.
AbbVie generates strong operating cash, but free cash flow is not all surplus cash for shareholders.
AbbVie (ABBV), from our memo of October 30, 2026 · AbbVie stock forecast
Stock compensation also belongs in the economic calculation. Amgen added back $494 million of stock pay in operating cash flow because issuing shares is not an immediate cash payment. Deducting it gives real free cash flow of $7,606 million, or 20.7% of revenue. That remains substantial, but it was below the $8,040 million achieved in 2021.
Amgen (AMGN), from our memo of October 13, 2026 · Amgen stock forecast
What does an investor pay for AbbVie and Amgen today?
The shares of AbbVie were priced at 50.1x the last 12 months’ earnings and 17.9x the next 12 months’ on October 30, 2026; those of Amgen at 26.0x the last 12 months’ earnings and 17.1x the next 12 months’ on October 12, 2026. AbbVie’s free cash flow yield was 3.5% on October 30, 2026; Amgen’s was 3.6% on October 12, 2026.
Today’s price requires durable growth from Amgen’s established portfolio, with MariTide providing uncertain additional value. The forward P/E of 17.1x and share price of $417.57 imply estimated annual earnings of about $24.42 per share. That estimate exceeds Amgen’s full-year 2026 adjusted earnings guidance of $22.30–$23.50, although the periods are not identical.
Amgen (AMGN), from our memo of October 13, 2026 · Amgen stock forecast