Johnson & Johnson vs AbbVie stock: the numbers side by side (October 2026)
How do Johnson & Johnson and AbbVie compare?
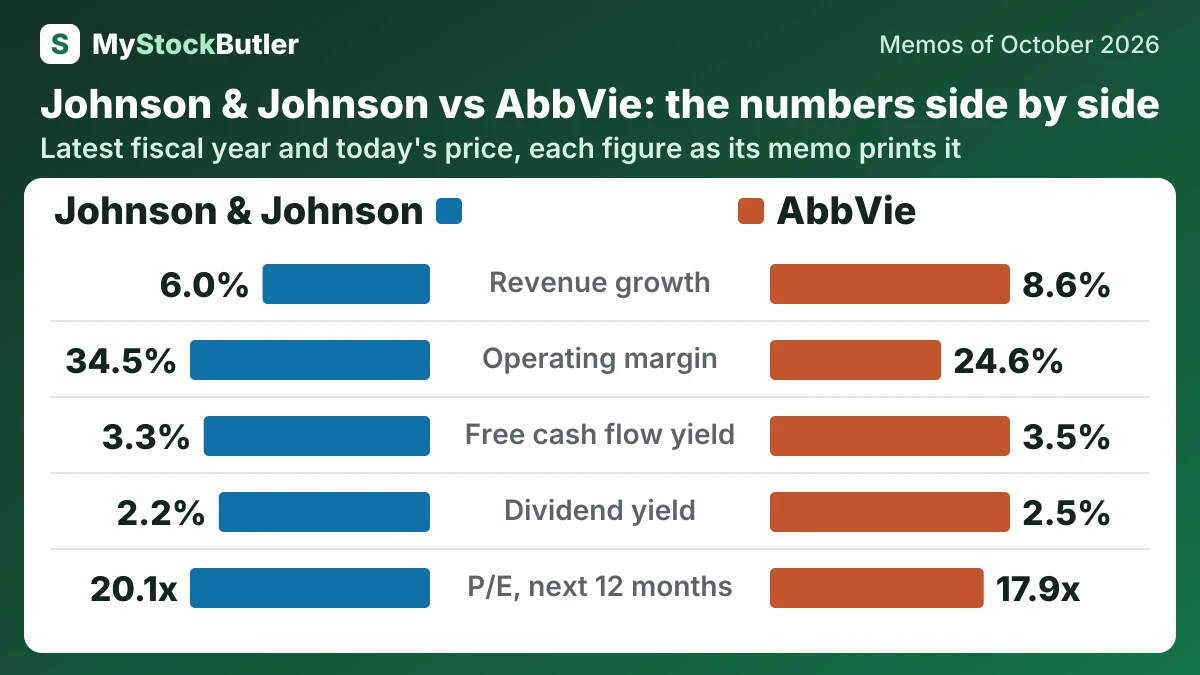
| Johnson & Johnson JNJ | AbbVie ABBV | |
|---|---|---|
| Revenue growth | 6.0%2025 | 8.6%2025 |
| Operating margin | 34.5%2025 | 24.6%2025 |
| Free cash flow | 19,536US$ millions · 2025 | 17,816US$ millions · 2025 |
| Free cash flow yield | 3.3%Today (Oct 14, 2026) | 3.5%Today (Oct 30, 2026) |
| Dividend yield | 2.2%Today (Oct 14, 2026) | 2.5%Today (Oct 30, 2026) |
| P/E, last 12 months | 37.7xToday (Oct 14, 2026) | 50.1xToday (Oct 30, 2026) |
| P/E, next 12 months | 20.1xToday (Oct 14, 2026) | 17.9xToday (Oct 30, 2026) |
| Weighted price forecast, about 1 year | 229.07 (-6%)October 2027 | 285.67 (+1 %)October 2027 |
| Weighted price forecast, about 3 years | 251.90 (+8%)October 2029 | 311.73 (+15 %)October 2029 |
Who leads on what?
| Leads | The lead is | |
|---|---|---|
| Revenue growth | AbbVie | The higher figure |
| Operating margin | Johnson & Johnson | The higher figure |
| Free cash flow | Johnson & Johnson | The higher figure |
| Free cash flow yield | AbbVie | The higher figure |
| Dividend yield | AbbVie | The higher figure |
| P/E, last 12 months | Johnson & Johnson | The lower figure |
| P/E, next 12 months | AbbVie | The lower figure |
| Weighted price forecast, about 1 year | AbbVie | The higher weighted return |
| Weighted price forecast, about 3 years | AbbVie | The higher weighted return |
What does each company do?
Johnson & Johnson sells prescription medicines and medical devices through Innovative Medicine and MedTech.
Johnson & Johnson (JNJ), from our memo of October 14, 2026 · Johnson & Johnson stock forecast
AbbVie sells prescription medicines in immunology, neuroscience and oncology, along with medical-aesthetics products such as Botox Cosmetic and Juvéderm.
AbbVie (ABBV), from our memo of October 30, 2026 · AbbVie stock forecast
How big are Johnson & Johnson and AbbVie?
Johnson & Johnson had a market value of US$599,125 million on October 14, 2026, and AbbVie a market value of US$514,178.12 million on October 30, 2026.
How fast are Johnson & Johnson and AbbVie growing, and what did their latest results show?
Johnson & Johnson’s revenue grew 6.0% in 2025; AbbVie’s grew 8.6% in 2025.
September 2026 revenue rose 5.9% year over year, while organic growth reached 6.1%. Gross margin fell from 69.6% to 68.1%, but that modest change cannot explain operating income collapsing from $7,511 million to $65 million.
Johnson & Johnson (JNJ), from our memo of October 14, 2026 · Johnson & Johnson earnings
The latest quarter confirms continued sales progress, but its earnings growth is amplified by a weak comparison.
AbbVie (ABBV), from our memo of October 30, 2026 · AbbVie earnings
How much cash do Johnson & Johnson and AbbVie generate, and where does it go?
At Johnson & Johnson, free cash flow came to US$19,536 million in 2025; at AbbVie, it came to US$17,816 million in 2025. The dividend yield stood at 2.2% on October 14, 2026 for Johnson & Johnson and 2.5% on October 30, 2026 for AbbVie.
Profit records accounting income; cash flow records money collected and paid. J&J’s operating cash flow was $24,530 million in 2025, while free cash flow after capital spending was $19,536 million. A sale may be recorded before the customer pays, and inventory may consume cash before it is sold.
Johnson & Johnson (JNJ), from our memo of October 14, 2026 · Johnson & Johnson stock forecast
AbbVie generates strong operating cash, but free cash flow is not all surplus cash for shareholders.
AbbVie (ABBV), from our memo of October 30, 2026 · AbbVie stock forecast
What does an investor pay for Johnson & Johnson and AbbVie today?
The shares of Johnson & Johnson were priced at 37.7x the last 12 months’ earnings and 20.1x the next 12 months’ on October 14, 2026; those of AbbVie at 50.1x the last 12 months’ earnings and 17.9x the next 12 months’ on October 30, 2026. At Johnson & Johnson, the free cash flow yield was 3.3% on October 14, 2026; at AbbVie, it was 3.5% on October 30, 2026.
At $248.61, shareholders value J&J’s equity at $599,125 million. Enterprise value is $627,403 million because it adds net debt to the equity value. The difference is like buying a house while taking responsibility for its mortgage: the shares belong to investors, but the operating business must also support lenders. The EV-to-revenue multiple therefore values the whole business, not merely the stock.
Johnson & Johnson (JNJ), from our memo of October 14, 2026 · Johnson & Johnson dividend