AbbVie vs Merck stock: the numbers side by side (October 2026)
How do AbbVie and Merck compare?
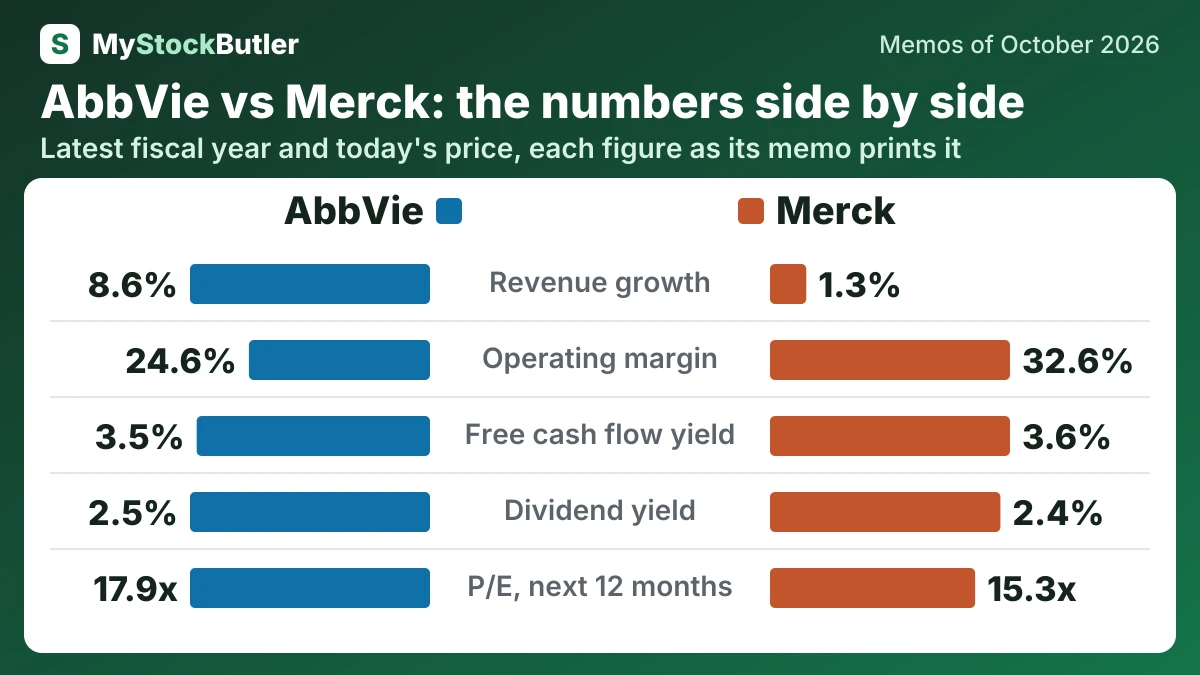
| AbbVie ABBV | Merck MRK | |
|---|---|---|
| Revenue growth | 8.6%2025 | 1.3%2025 |
| Operating margin | 24.6%2025 | 32.6%2025 |
| Free cash flow | 17,816US$ millions · 2025 | 12,360US$ millions · 2025 |
| Free cash flow yield | 3.5%Today (Oct 30, 2026) | 3.6%Today (Oct 29, 2026) |
| Dividend yield | 2.5%Today (Oct 30, 2026) | 2.4%Today (Oct 29, 2026) |
| P/E, last 12 months | 50.1xToday (Oct 30, 2026) | 145.5xToday (Oct 29, 2026) |
| P/E, next 12 months | 17.9xToday (Oct 30, 2026) | 15.3xToday (Oct 29, 2026) |
| Weighted price forecast, about 1 year | 285.67 (+1 %)October 2027 | 134.03 (-3 %)October 2027 |
| Weighted price forecast, about 3 years | 311.73 (+15 %)October 2029 | 101.17 (-21 %)October 2029 |
Who leads on what?
| Leads | The lead is | |
|---|---|---|
| Revenue growth | AbbVie | The higher figure |
| Operating margin | Merck | The higher figure |
| Free cash flow | AbbVie | The higher figure |
| Free cash flow yield | Merck | The higher figure |
| Dividend yield | AbbVie | The higher figure |
| P/E, last 12 months | AbbVie | The lower figure |
| P/E, next 12 months | Merck | The lower figure |
| Weighted price forecast, about 1 year | AbbVie | The higher weighted return |
| Weighted price forecast, about 3 years | AbbVie | The higher weighted return |
What does each company do?
AbbVie sells prescription medicines in immunology, neuroscience and oncology, along with medical-aesthetics products such as Botox Cosmetic and Juvéderm.
AbbVie (ABBV), from our memo of October 30, 2026 · AbbVie stock forecast
Merck & Co. sells medicines and vaccines for people and animals.
Merck (MRK), from our memo of October 29, 2026 · Merck stock forecast
How fast are AbbVie and Merck growing, and what did their latest results show?
AbbVie’s revenue grew 8.6% in 2025; Merck’s grew 1.3% in 2025.
The latest quarter confirms continued sales progress, but its earnings growth is amplified by a weak comparison.
AbbVie (ABBV), from our memo of October 30, 2026 · AbbVie earnings
Revenue reached $18.1 billion, up 4.7% from the September 2025 quarter. Keytruda and Keytruda Qlex grew together, while Winrevair, Merck’s pulmonary-arterial-hypertension treatment, grew 93%. Bridion fell 67% and Januvia/Janumet fell 39% as generic competition and lost exclusivity hurt older products.
Merck (MRK), from our memo of October 29, 2026 · Merck earnings
How much cash do AbbVie and Merck generate, and where does it go?
At AbbVie, free cash flow came to US$17,816 million in 2025; at Merck, it came to US$12,360 million in 2025. The dividend yield stood at 2.5% on October 30, 2026 for AbbVie and 2.4% on October 29, 2026 for Merck.
AbbVie generates strong operating cash, but free cash flow is not all surplus cash for shareholders.
AbbVie (ABBV), from our memo of October 30, 2026 · AbbVie stock forecast
Free cash flow means operating cash after capital spending on factories and equipment. Merck generated $16.5 billion from operations and spent $4.1 billion on capital assets in 2025, leaving $12.4 billion of free cash flow. That fell from $18.1 billion in 2024 even though reported net income increased.
Merck (MRK), from our memo of October 29, 2026 · Merck stock forecast
What does an investor pay for AbbVie and Merck today?
The shares of AbbVie were priced at 50.1x the last 12 months’ earnings and 17.9x the next 12 months’ on October 30, 2026; those of Merck at 145.5x the last 12 months’ earnings and 15.3x the next 12 months’ on October 29, 2026. At AbbVie, the free cash flow yield was 3.5% on October 30, 2026; at Merck, it was 3.6% on October 29, 2026.
The price-to-earnings ratio, or P/E, compares a share price with profit per share. A trailing P/E uses the past twelve months; a forward P/E uses an estimate of the next twelve months. Merck’s two measures differ sharply because acquisition and licensing charges made recent profit unusually small, while forward earnings assume those charges will not recur. The forward figure may be more useful for ordinary earning power, but it still depends on forecasts and on successful replacement drugs.
Merck (MRK), from our memo of October 29, 2026 · Merck stock forecast