TELUS earnings: guidance and results
MyStockButler's October 2026 analysis: TELUS expects its next results on November 6, 2026. Watch mobile churn and ARPU together.
What has TELUS guided for the year?
July 2026 guidance calls for service revenue growth of -2.0% to 0.0% and adjusted EBITDA growth of -4.0% to -2.0%. Capital expenditure is expected at C$2,600 million, with C$1,800 million of free cash flow in 2026. Management promises at least 10% annual free-cash-flow growth in 2027 and 2028 and roughly 3.0x leverage by the end of 2028.
| Period guided | Low | High | Date given | |
|---|---|---|---|---|
| Consolidated service revenue growth | Year to Dec 2026 | -2.0% | 0.0% | 2026-07-31 |
| Consolidated Adjusted EBITDA growth | Year to Dec 2026 | -4.0% | -2.0% | 2026-07-31 |
| Capital expenditures | Year to Dec 2026 | 2,600 | 2,600 | 2026-07-31 |
| Free cash flow | Year to Dec 2026 | 1,800 | 1,800 | 2026-07-31 |
Did TELUS keep its past promises?
Promises also need dates. TELUS’s 2025 scorecard shows that TTech revenue growth missed its target while adjusted operating-profit growth met it. The company announced a dividend-growth ambition in May 2025, paused increases in December and cut the dividend in July 2026. The cut may protect the balance sheet, but it clearly departs from the earlier ambition.
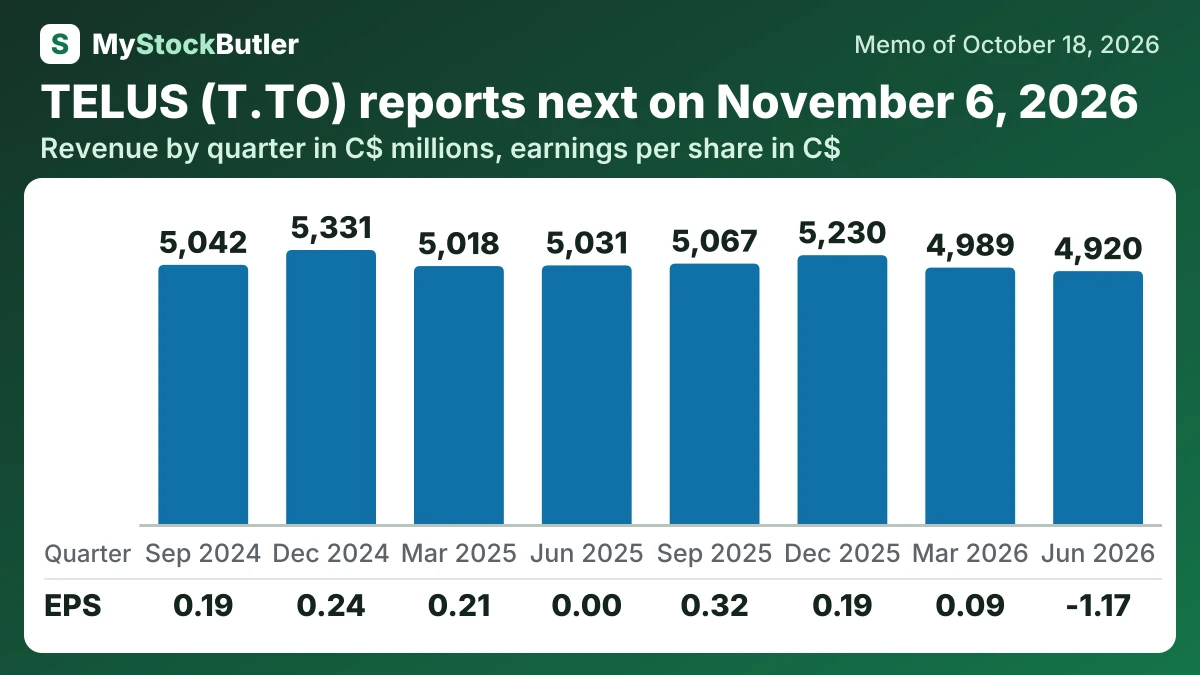
What is the trend in TELUS revenue and profit?
Removing the latest impairment alone produces operating income of C$563 million and common-share net income of C$76 million. Removing comparable impairments from both periods still leaves ordinary earnings weaker. Management’s adjusted EPS was C$0.16, down from C$0.22 a year earlier, which supports that reading.
| Jun 2026 | Mar 2026 | Dec 2025 | Sep 2025 | Jun 2025 | Mar 2025 | Dec 2024 | Sep 2024 | |
|---|---|---|---|---|---|---|---|---|
| Revenue | 4,920 | 4,989 | 5,230 | 5,067 | 5,031 | 5,018 | 5,331 | 5,042 |
| Operating income | -1,572 | 534 | 694 | 742 | 175 | 752 | 759 | 788 |
| Net income | -1,840 | 136 | 292 | 493 | 7 | 321 | 358 | 280 |
| EPS, diluted | -1.17 | 0.09 | 0.19 | 0.32 | 0.00 | 0.21 | 0.24 | 0.19 |
What this means. March 2026 free cash flow is negative because our calculation includes the full 845 million Canadian dollars of lease principal paid, while the company leaves out discretionary lease principal.
What should you watch in TELUS’s next results?
The recovery will be credible only if TELUS improves customer economics while meeting construction, regulatory and debt commitments. In mobile, watch churn, the share of customers who disconnect, alongside ARPU, or average revenue per user. TELUS’s monthly phone churn was 1.08% in Q2, versus 1.06% a year earlier. Rogers, a Canadian wireless rival, reported 0.94%. A discount can lower churn while also lowering ARPU, so the measures belong together.
Spectrum could collide directly with the debt promise. ISED moved the auction to January 25, 2028, with applications and full deposits due August 31, 2027. A comparable Canadian auction averaged about C$1.40 per MHz-pop. The final price is unknown, but the timing is clear: a large spectrum payment could compete with debt reduction and AI investment in the same year TELUS has promised to reach roughly 3.0-times leverage. That is the cash test that will decide whether the plan is durable.