TELUS stock forecast 2027–2029
MyStockButler's October 2026 analysis: TELUS's weighted price is C$15.44 in October 2029, based on bear 35%, base 50% and bull 15% scenarios. It hinges on Digital retaining clients, while fibre and Health support TELUS and wireless economics improve.
Where could TELUS's shares be in each forecast year?
TELUS’s weighted forecast points higher if cash recovers and debt falls. The weighted price is C$12.87 in October 2027, a +14% return. It reaches C$15.44 in October 2029, a +45% return. Case probabilities are bear 35%, base 50% and bull 15%; the October 2029 range is C$4.81 to C$28.05.
The weighted price is C$12.87 in October 2027, producing a 14% return including dividends. It reaches C$13.33 in October 2028, for a 23% total return. By October 2029, the weighted price is C$15.44, or a 45% total return.
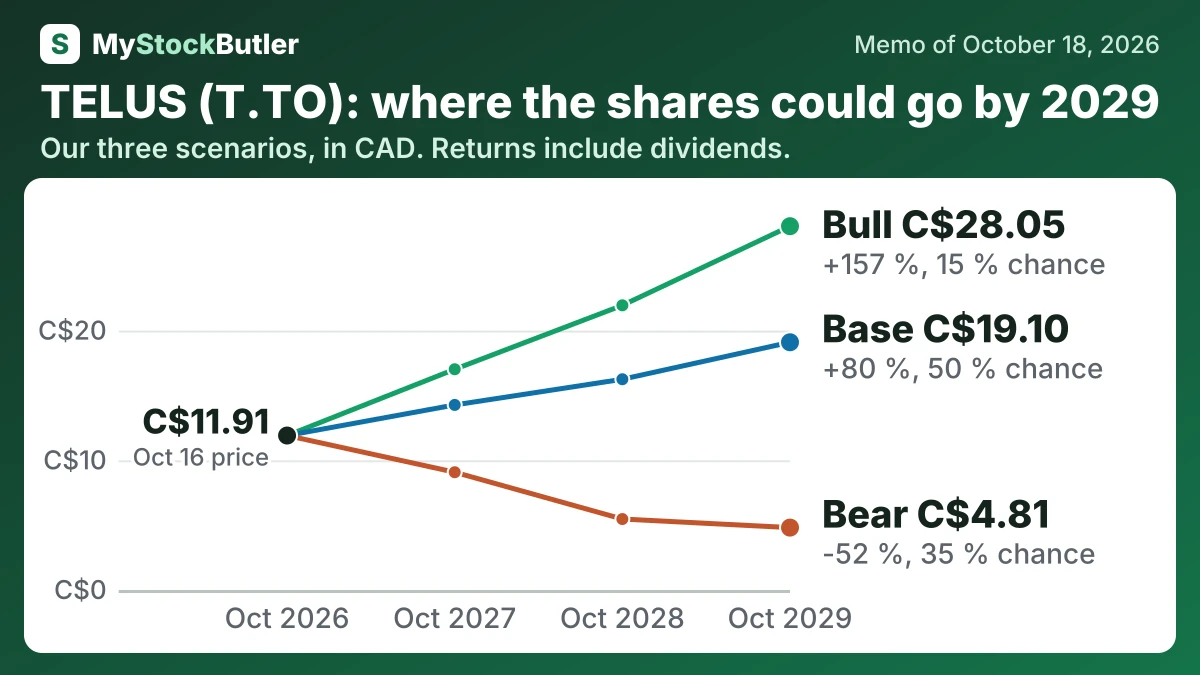
| Case | Probability | October 2027 | October 2028 | October 2029 |
|---|---|---|---|---|
| Bear | 35 % | 9.08 (-20 %) | 5.47 (-47 %) | 4.81 (-52 %) |
| Base | 50 % | 14.27 (+26 %) | 16.25 (+49 %) | 19.10 (+80 %) |
| Bull | 15 % | 17.02 (+49 %) | 21.95 (+98 %) | 28.05 (+157 %) |
| Weighted | 100 % | 12.87 (+14 %) | 13.33 (+23 %) | 15.44 (+45 %) |
What has to go right for TELUS, and what could go wrong?
EBITDA is the operating anchor. The base path rises gradually because cost savings and a stabilizing Digital business partly offset weak wireless economics. Adjusted EBITDA was C$7,354 million in 2025, barely above the prior year, while 2026 guidance implies a lower midpoint of C$7,133 million. The bear case extends that decline as automation, competition and spectrum needs overwhelm savings. The bull case assumes Digital retains clients, sells AI-enabled services and gains support from fibre and Health.
How much cash does TELUS really make?
TELUS’s own 2025 free cash flow was C$2,208 million, above the simpler cash measure. After allowing for C$144 million of stock compensation, the simpler measure leaves C$1,461 million. The useful reading keeps company-defined cash, cash after actual investment and cash after stock pay visible.
| 2025 | 2024 | 2023 | 2022 | 2021 | |
|---|---|---|---|---|---|
| Cash from operations | 4,866 | 4,847 | 4,499 | 4,811 | 4,388 |
| − Capital spending | 2,515 | 2,750 | 3,182 | 3,647 | 3,097 |
| = Free cash flow | 1,605 | 1,436 | 779 | 669 | 789 |
| − Stock pay | 144 | 151 | 117 | 122 | 139 |
| = Real free cash flow | 1,461 | 1,285 | 662 | 547 | 650 |
What this means. The company's own free cash flow is higher because it leaves out some cash costs and stock pay that we count.
What does an investor pay for TELUS today?
Free cash flow is cash left after operating costs, taxes, interest and investment. It can repay debt, fund acquisitions, buy assets or support dividends, so its yield is not automatically distributable. TELUS now targets dividends equal to 45–60% of trailing twelve-month free cash flow, with quarterly board approval. The table shows the current share price, valuation multiples, book value, cash yields and dividend yield.
| Today (Oct 18, 2026) | |
|---|---|
| Share price | 11.91 |
| P/E, last 12 months (calculated) | not meaningful |
| P/E, next 12 months (calculated) | 17.0x |
| Free cash flow yield (calculated) | 8.5% |
| Real free cash flow yield (calculated) | 7.7% |
| Dividend yield (calculated) | 6.3% |
What this means. The last-12-month price-to-earnings ratio is not meaningful because the company lost money over that period.