Schneider Electric earnings
MyStockButler's October 2026 analysis: The latest reported results show strong revenue growth and improving demand across Energy Management and Industrial Automation. The next release should show whether shipments became collections and restructuring stayed within expectations.
What has Schneider Electric guided for 2026?
Management guided to 12–14% organic revenue growth for 2026 on October 16, 2026. It also guided to 18–21% organic adjusted EBITA growth and a 19.7–19.9% adjusted EBITA margin.
| Period | Low | High | Given on | |
|---|---|---|---|---|
| Adjusted EBITA growth (organic, %) | Year to Dec 2026 | 18.0% | 21.0% | Oct 16, 2026 |
| Revenue growth (organic, %) | Year to Dec 2026 | 12.0% | 14.0% | Oct 16, 2026 |
| Adjusted EBITA margin (%) | Year to Dec 2026 | 19.7% | 19.9% | Oct 16, 2026 |
What this means. The normalized restructuring cost of 100 to 150 million euros per year is a baseline for comparing extra costs, not the company's total restructuring bill for 2026.
Has Schneider Electric kept its past promises?
The historical review found that every selected original range was met or exceeded, although management later signalled a softer position toward the lower half of some 2025 ranges. The promise, then, is credible but incomplete: the real test is whether sales growth survives delivery costs, pricing pressure, restructuring and financing. That question leads directly to the analysts’ forecasts.
| What management forecast | Checked | Above | Within | Below |
|---|---|---|---|---|
| Revenue growth | 5 years | 4 | 1 | 0 |
| Adjusted EBITA growth | 5 years | 4 | 1 | 0 |
| Adjusted EBITA margin | 5 years | 3 | 2 | 0 |
What this means. The company’s reported sales growth includes businesses it bought or sold, while organic growth leaves those changes out.
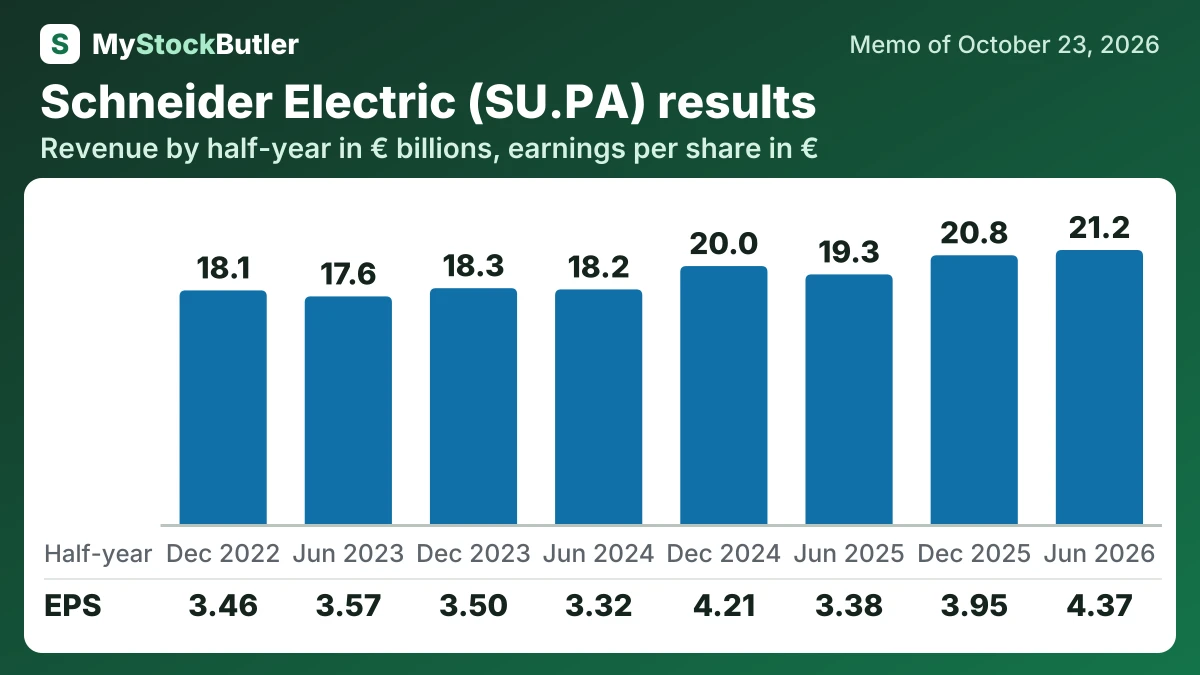
What do Schneider Electric’s revenue and profit results show?
Gross margin shows what remains after producing and delivering the offering, before support costs. It fell from 42.6% in 2024 to 42.1% in 2025. Adjusted EBITA, meaning operating earnings before interest, tax, and amortization of acquisition-related intangibles, rose from €7,083 million to €7,520 million.
Q3 2026 revenue was €11,460 million and organic growth was 16.9%. Energy Management grew 18.8% organically, while Industrial Automation grew 8.1%. Products, Systems, and Software & Services all grew, with Systems strongest. Management also raised its full-year growth guidance.
| 6 months to Jun 2026 | 6 months to Dec 2025 | 6 months to Jun 2025 | 6 months to Dec 2024 | 6 months to Jun 2024 | 6 months to Dec 2023 | 6 months to Jun 2023 | 6 months to Dec 2022 | |
|---|---|---|---|---|---|---|---|---|
| Revenue | 21,226 | 20,816 | 19,336 | 19,980 | 18,173 | 18,269 | 17,633 | 18,099 |
| Gross margin | 42.5% | 41.8% | 42.4% | 41.9% | 43.4% | 41.2% | 42.4% | 40.6% |
| Operating income | 3,613 | 3,476 | 3,223 | 3,444 | 3,005 | 2,981 | 2,952 | 2,746 |
| Net income | 2,488 | 2,250 | 1,913 | 2,387 | 1,882 | 1,980 | 2,023 | 1,958 |
| EPS, diluted | 4.37 | 3.95 | 3.38 | 4.21 | 3.32 | 3.50 | 3.57 | 3.46 |
What this means. The periods ending in December are the second half of the year, calculated by subtracting the first half from the full year rather than reported separately.
What should people watch in Schneider Electric’s next release?
Full-year 2026 results are scheduled for February 18, 2027. They should show whether shipments became collections, whether restructuring stayed within expectations and whether the outlook can absorb financing demands.