Snap-on stock forecast 2027–2029
MyStockButler's October 2026 analysis: The weighted forecast puts Snap-on at $356.88 in October 2027. It hinges on van replenishment returning while technician demand remains stable.
Where could Snap-on's shares be by October 2029?
The forecast puts Snap-on’s share price at $356.88 in October 2027, $369.31 in October 2028, and $380.17 in October 2029, excluding dividends. Against today’s $352.83, that is a 4%, 11%, and 17% total return.
The forecast assigns 30% to bear, 52% to base, and 18% to bull. The base case is most likely because it requires gradual replenishment, not a sharp recovery; the bear case remains material because tools and repair sales are already weak.
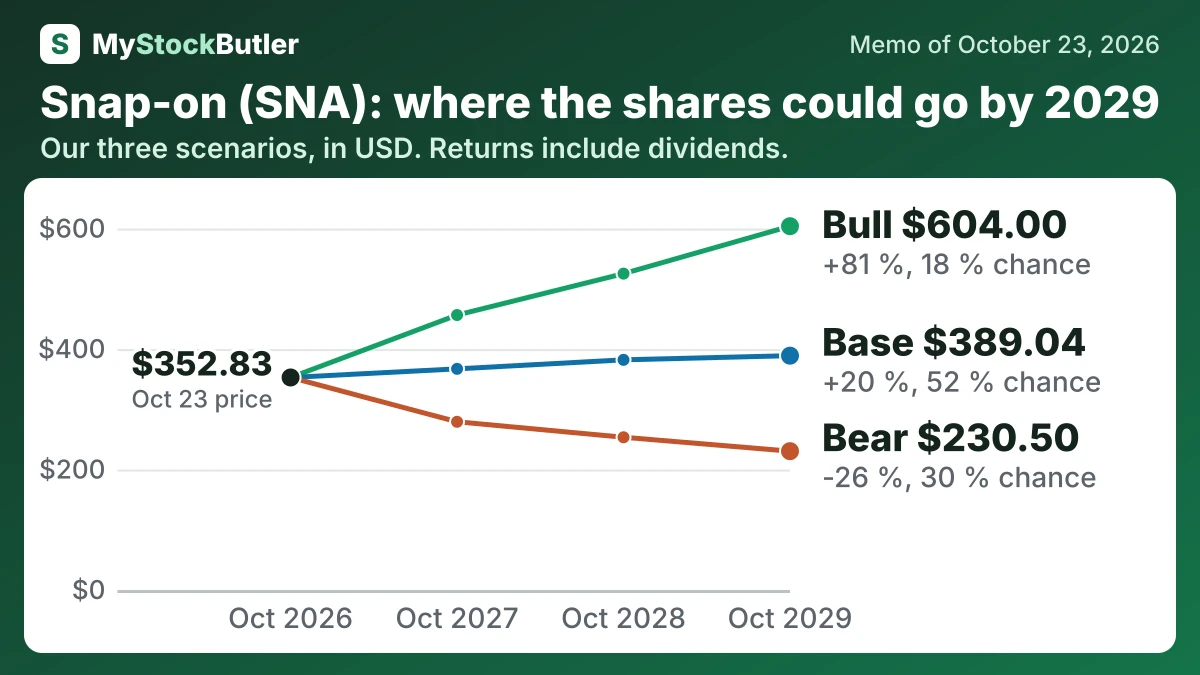
| Case | Probability | October 2027 | October 2028 | October 2029 |
|---|---|---|---|---|
| Bear | 30 % | 279.27 (-18 %) | 253.54 (-23 %) | 230.50 (-26 %) |
| Base | 52 % | 367.17 (+7 %) | 382.13 (+14 %) | 389.04 (+20 %) |
| Bull | 18 % | 456.50 (+32 %) | 525.24 (+55 %) | 604.00 (+81 %) |
| Weighted | 100 % | 356.88 (+4 %) | 369.31 (+11 %) | 380.17 (+17 %) |
What has to go right or wrong for Snap-on's forecast?
The bear case assumes revenue declines 2%, then 1% annually, while margins fall from 18.1% to 17.4%; earnings decline from $927 million to $873 million. The bull case assumes 4% growth followed by 5%, with margins expanding from 20.4% to 21.9%; earnings reach $1,312 million. Tools Group organic sales fell 7.0% and Repair Systems & Information fell 5.5% in the latest quarter, while Commercial & Industrial grew 7.4%, supporting this wide range.
How much cash does Snap-on really make?
Excluding Financial Services, fiscal 2025 operating cash flow was $857.3 million. After $75.0 million of capital spending, free cash flow was $782.3 million. Deducting $28.9 million of stock compensation produces an analytical “real free cash flow”: the deduction recognises value transferred to employees and the possible need to repurchase shares to prevent dilution.
| Jan 2026 | 2024 | 2023 | 2022 | Jan 2022 | |
|---|---|---|---|---|---|
| Cash from operations | 857.3 | 1,004.9 | 973.6 | 490.5 | 788.3 |
| − Capital spending | 75.0 | 82.9 | 93.2 | 83.1 | 69.3 |
| = Free cash flow | 782.3 | 922.0 | 880.4 | 407.4 | 719.0 |
| − Stock pay | 28.9 | 28.6 | 44.7 | 34.0 | 41.4 |
| = Real free cash flow | 753.4 | 893.4 | 835.7 | 373.4 | 677.6 |
| Real free cash flow, % of revenue | 14.6% | 17.5% | 16.4% | 7.7% | 14.7% |
What this means. The company's own free cash flow matches ours, but our real free cash flow is lower because shares given to employees reduce each shareholder's ownership even though no cash leaves the company.
What does an investor pay for Snap-on today?
At $352.83, Snap-on’s price assumes that its tools and lending businesses can sustain substantial profits and eventually grow them.
| Today (Oct 23, 2026) | |
|---|---|
| Share price | 352.83 |
| Market value (calculated) | 18,199.4 |
| Enterprise value (calculated) | 16,547.9 |
| P/E, last 12 months (calculated) | 18.3x |
| P/E, next 12 months (calculated) | 18.1x |
| Real free cash flow yield (calculated) | 4.1% |
What this means. The earnings and sales include the financial services business, but the cash and debt used for some measures do not, so those measures mix different parts of the company.