Supermicro stock forecast 2027–2029
MyStockButler's October 2026 analysis: The weighted forecast reaches $73.75 in October 2027 and $97.77 in October 2029. It hinges on improving cash conversion.
Where could Supermicro’s shares be by October 2029?
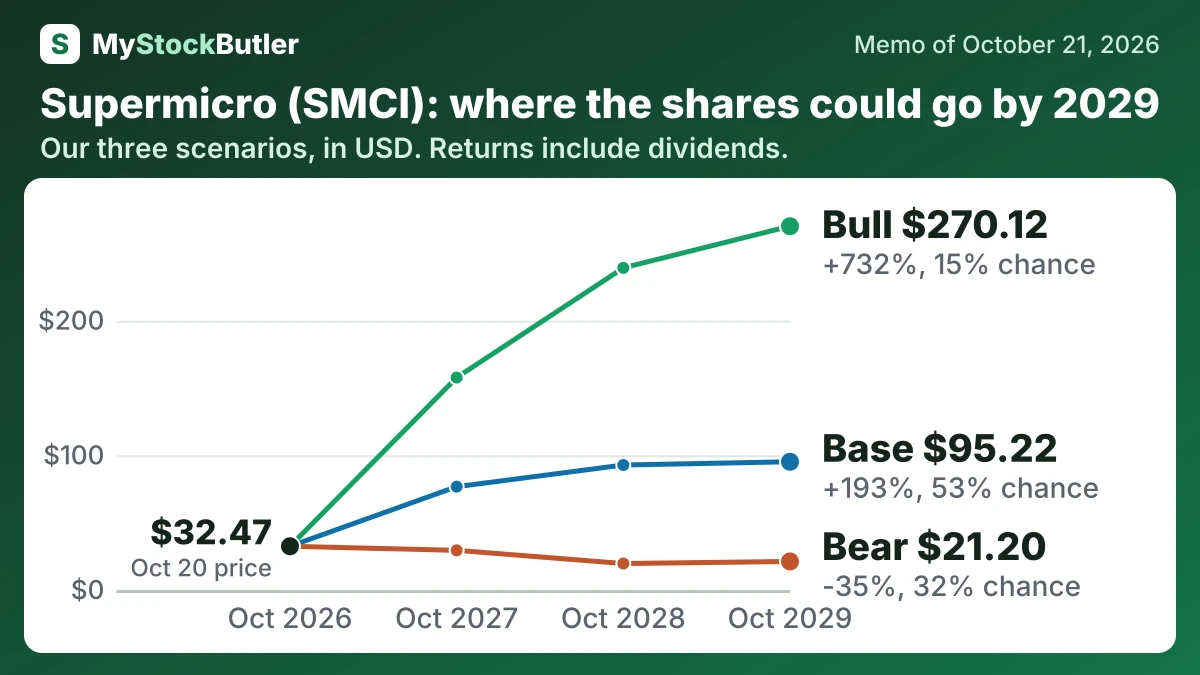
The weighted forecast reaches $73.75 in October 2027, a +127% return including dividends. It reaches $97.77 in October 2029, a +201% return. Bear carries 32% probability and base 53%; bull carries 15%. The base case requires growing EBITDA—operating earnings before interest, taxes and certain accounting costs—and improving collections without excessive dilution. The bear case is delay and cash stress. The bull case is repeat rack deployments and stronger integration economics.
| Case | Probability | October 2027 | October 2028 | October 2029 |
|---|---|---|---|---|
| Bear | 32% | 29.44 (-9%) | 19.65 (-39%) | 21.20 (-35%) |
| Base | 53% | 76.73 (+136%) | 92.80 (+186%) | 95.22 (+193%) |
| Bull | 15% | 157.74 (+386%) | 239.19 (+637%) | 270.12 (+732%) |
| Weighted | 100% | 73.75 (+127%) | 91.35 (+181%) | 97.77 (+201%) |
What this means. The weighted row is the average value after giving more weight to the cases considered more likely.
What has to go right or wrong for Supermicro?
| October 2027 | October 2028 | October 2029 | |
|---|---|---|---|
| EBITDA | 6,541 (4,560 / 8,493) | 7,348 (4,203 / 10,682) | 8,249 (4,591 / 12,647) |
| Shares (millions) | 677 (694 / 669) | 712 (741 / 676) | 867 (923 / 835) |
| Dividends per share | 0.00 (0.00 / 0.00) | 0.00 (0.00 / 0.00) | 0.00 (0.00 / 0.00) |
| Enterprise value to ebitda | 8.00 (5.50 / 12.00) | 8.50 (4.50 / 14.00) | 9.00 (5.00 / 16.00) |
| Net debt | 422 (4,638 / -3,596) | -3,636 (4,342 / -12,234) | -8,321 (3,378 / -23,158) |
What this means. Negative net debt means the company has more cash than borrowed money.
How much cash does Supermicro really make?
Stock-based compensation creates a further distinction. Employees receive equity instead of equivalent immediate cash, but shareholders still bear an economic cost through dilution. This memo’s “real free cash flow” measure subtracts that cost for analysis; it is not an additional cash payment.
| Jun 2026 | Jun 2025 | Jun 2024 | Jun 2023 | Jun 2022 | |
|---|---|---|---|---|---|
| Cash from operations | -6,809,886 | 1,659,524 | -2,485,972 | 663,580 | -440,801 |
| − Capital spending | 161,999 | 127,214 | 124,279 | 36,793 | 45,182 |
| = Free cash flow | -6,971,885 | 1,532,310 | -2,610,251 | 626,787 | -485,983 |
| − Stock pay | 412,115 | 314,452 | 231,507 | 54,433 | 32,816 |
| = Real free cash flow | -7,384,000 | 1,217,858 | -2,841,758 | 572,354 | -518,799 |
| Real free cash flow, % of revenue | -18.9% | 5.5% | -19.0% | 8.0% | -10.0% |
What this means. Stock pay is subtracted even though no cash left the business because giving employees shares reduces the portion of the company left for other shareholders.
What does an investor pay for Supermicro today?
The earnings figures look attractive, but cash tells a harder story. Supermicro trades at 10.1x trailing earnings and 7.5x forecast earnings. Yet its free cash flow yield is -27.3%. Free cash flow is the money left after operating needs and capital spending. Supermicro may buy GPUs and other components, assemble a rack, record the sale, and wait for payment. Profit can appear while cash remains trapped in inventory and customer invoices.