Skydance Corporation earnings date
MyStockButler's October 2026 analysis: Skydance Corporation's next results are expected on November 9, 2026. Skydance Corporation's key watch is whether cash improves after transformation costs and before the acquisition shows a full quarter.
What has Skydance Corporation guided for 2026?
The August 4 guidance covers Paramount before the acquisition. For 2026, management expects $30 billion of revenue and adjusted EBITDA of $3.8–3.9 billion, with a 12.8% margin. Adjusted EBITDA estimates operating performance before interest, taxes, depreciation and amortization, plus selected adjustments. Free cash flow is the money left after operating costs and capital spending.
| Period guided | Low | High | Date given | |
|---|---|---|---|---|
| Total Revenue (Year to Dec 2026) | Year to Dec 2026 | 30,000 | 30,000 | Aug 4, 2026 |
| Y/Y Growth (%) (Year to Dec 2026) | Year to Dec 2026 | 4.0% | 4.0% | Aug 4, 2026 |
| Adj. EBITDA (Year to Dec 2026) | Year to Dec 2026 | 3,800 | 3,900 | Aug 4, 2026 |
| Adj. EBITDA Margin (%) (Year to Dec 2026) | Year to Dec 2026 | 12.8% | 12.8% | Aug 4, 2026 |
| Free cash flow conversion (Year to Dec 2026) | Year to Dec 2026 | 10.0% | Aug 4, 2026 | |
| Transformation costs (Year to Dec 2026) | Year to Dec 2026 | 800 | 800 | Aug 4, 2026 |
What this means. The company's 10 percent free cash flow conversion target leaves out about 800 million dollars of transformation costs, so it may look stronger than the cash left after all costs.
Has Skydance Corporation shown evidence behind its promises?
There is operating evidence behind the promises. Skydance expected more than $2.7 billion of annualized efficiencies by year-end 2026 and retained an overall target above $3 billion. Run-rate savings describe the annual effect expected once changes are fully operating, not cash already saved. Later results must show whether those efficiencies became real cash generation after integration costs.
What do Skydance Corporation's last eight quarters show?
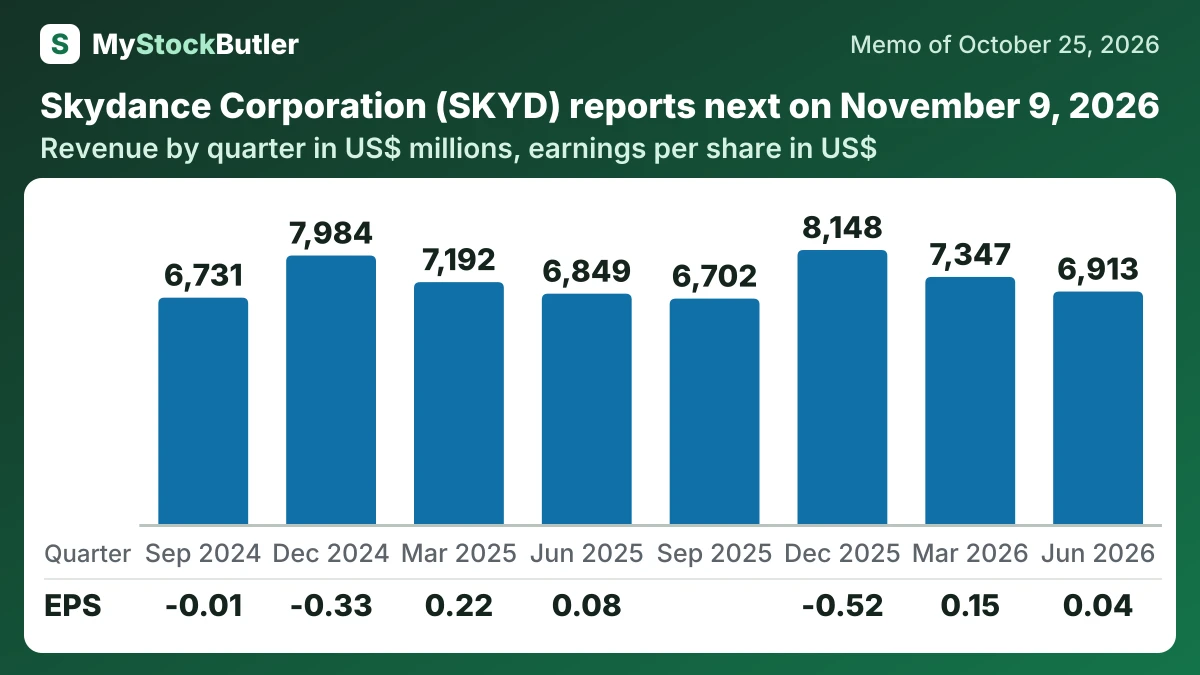
Revenue rose approximately 0.9% from the prior-year quarter. Gross margin improved from 32.5% to 35.7%, and operating income rose from $399 million to $475 million. Yet net income fell from $57 million to $41 million, while diluted EPS fell from $0.08 to $0.04. Financing costs, taxes, acquisition expenses and share issuance can therefore reverse a better operating result before it reaches shareholders.
| Jun 2026 | Mar 2026 | Dec 2025 | Sep 2025 | Jun 2025 | Mar 2025 | Dec 2024 | Sep 2024 | |
|---|---|---|---|---|---|---|---|---|
| Revenue | 6,913 | 7,347 | 8,148 | 6,702 | 6,849 | 7,192 | 7,984 | 6,731 |
| Gross margin | 35.7% | 33.9% | 28.7% | 35.2% | 32.5% | 31.0% | 28.7% | 35.5% |
| Operating income | 475 | 616 | -339 | 324 | 399 | 550 | 129 | 337 |
| Net income | 41 | 168 | -573 | -257 | 57 | 152 | -224 | -4 |
| EPS, diluted | 0.04 | 0.15 | -0.52 | 0.08 | 0.22 | -0.33 | -0.01 | |
| = Free cash flow | 258 | 96 | 101 | 15 | 114 | 123 | 56 | 214 |
What this means. Gross margin here is not just sales minus the direct cost of products: it also subtracts operating expenses and programming charges but leaves out depreciation and amortization.
What should investors watch in Skydance Corporation's next results?
Skydance’s November 9 results cover the quarter ended in September, before the acquisition. They can test standalone guidance but cannot show a full quarter of combined-company performance. The revenue forecast is $6.950–7.150 billion, and adjusted EBITDA forecast is $875–975 million. Actual cash and the expected $200 million of quarterly transformation costs will matter just as much.
Tax claims also deserve attention. July IRS notices proposed adjustments that could increase legacy Viacom taxes by approximately $400 million, excluding penalties and interest; Paramount disputed them. Older Westinghouse asbestos claims remain. Beyond November, watch the first full post-close quarter and the 2028 notes. Then test the end-2029 leverage target against the 2030 cash-flow promise.