Sanofi earnings date and guidance
MyStockButler's October 2026 analysis: Sanofi's next results are due on January 28, 2027. The key thing to watch is whether pricing, cash generation and launch momentum lasted through the fourth quarter.
What has Sanofi guided for 2026?
Management expects 2026 sales to grow by a low-teens percentage and business earnings per share to grow by a mid-teens percentage, both at constant exchange rates. Constant-exchange-rate growth removes currency movements; business EPS is Sanofi’s adjusted profit per share, excluding some impairments, restructuring and litigation costs. These measures show the business underneath currency swings and exceptional charges, but they are not the same as reported profit or cash.
| Period | Low | High | Given on | |
|---|---|---|---|---|
| Sales growth at CER | FY 2026 | Oct 30, 2026 | ||
| Business EPS growth at CER | FY 2026 | Oct 30, 2026 | ||
| Currency impact on sales | FY 2026 | -1.0% | -1.0% | Oct 30, 2026 |
| Currency impact on business EPS | FY 2026 | -1.0% | -1.0% | Oct 30, 2026 |
| Effective tax rate | FY 2026 | 21.0% | 21.0% | Oct 30, 2026 |
What this means. The blank low and high values mean Sanofi gave its sales and earnings growth targets in words rather than as exact percentages.
Did Sanofi keep its past promise?
Hudson’s 2025 bonus shows the limitation. The board awarded him €2.62 million, or 109% of target, while pipeline development scored below target. Sanofi also kept a sales promise: it forecast mid-to-high single-digit growth for 2025 at constant exchange rates and later reported 9.9% growth on that basis. Strong sales today, however, can coexist with disappointing research for tomorrow.
What is Sanofi's revenue and profit trend?
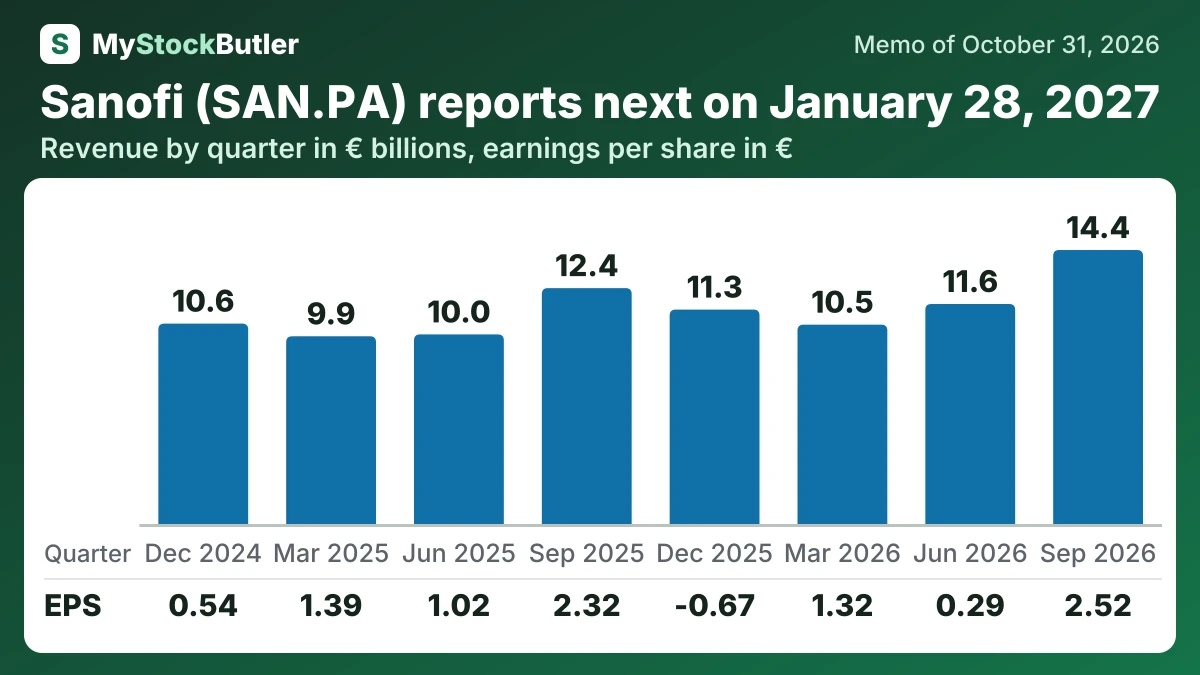
Quarterly revenue reached €14.444 billion, compared with €12.434 billion a year earlier. Growth was 14.3% at CER. Operating income rose from €3.623 billion to €4.349 billion, helped by Dupixent and newer medicines.
| Sep 2026 | Jun 2026 | Mar 2026 | Dec 2025 | Sep 2025 | Jun 2025 | Mar 2025 | Dec 2024 | |
|---|---|---|---|---|---|---|---|---|
| Revenue | 14,444 | 11,597 | 10,509 | 11,303 | 12,434 | 9,994 | 9,895 | 10,564 |
| Gross margin | 80.3% | 80.0% | 77.1% | 74.8% | 78.5% | 77.5% | 78.0% | 74.3% |
| Operating margin | 30.1% | 9.0% | 20.2% | -9.2% | 29.1% | 14.7% | 23.1% | 8.9% |
| EPS, diluted | 2.52 | 0.29 | 1.32 | -0.67 | 2.32 | 1.02 | 1.39 | 0.54 |
| Free cash flow | 3,266 | 2,436 | 1,093 | 2,724 | 3,276 | 1,015 | 1,355 | 3,087 |
What this means. The earnings per share figures labeled diluted actually use basic shares because Sanofi does not publish quarterly diluted figures.
What should investors watch in Sanofi's next results?
Management has promised a strategic update before the end of 2026. It should clarify expected launch timing, the role of acquisitions and how earnings will be protected as Dupixent faces competition. Full-year results on January 28, 2027 will show whether pricing, cash generation and launch momentum lasted through the fourth quarter.