Sanofi dividend: cash coverage and yield
MyStockButler's October 2026 analysis: Sanofi's forecast dividend rises from €4.33 in 2027 to €4.78 in 2029. Sanofi's 2025 free cash flow was €8.466 billion, but dividends and buybacks exceeded that year's free cash flow.
How much does Sanofi pay per share?
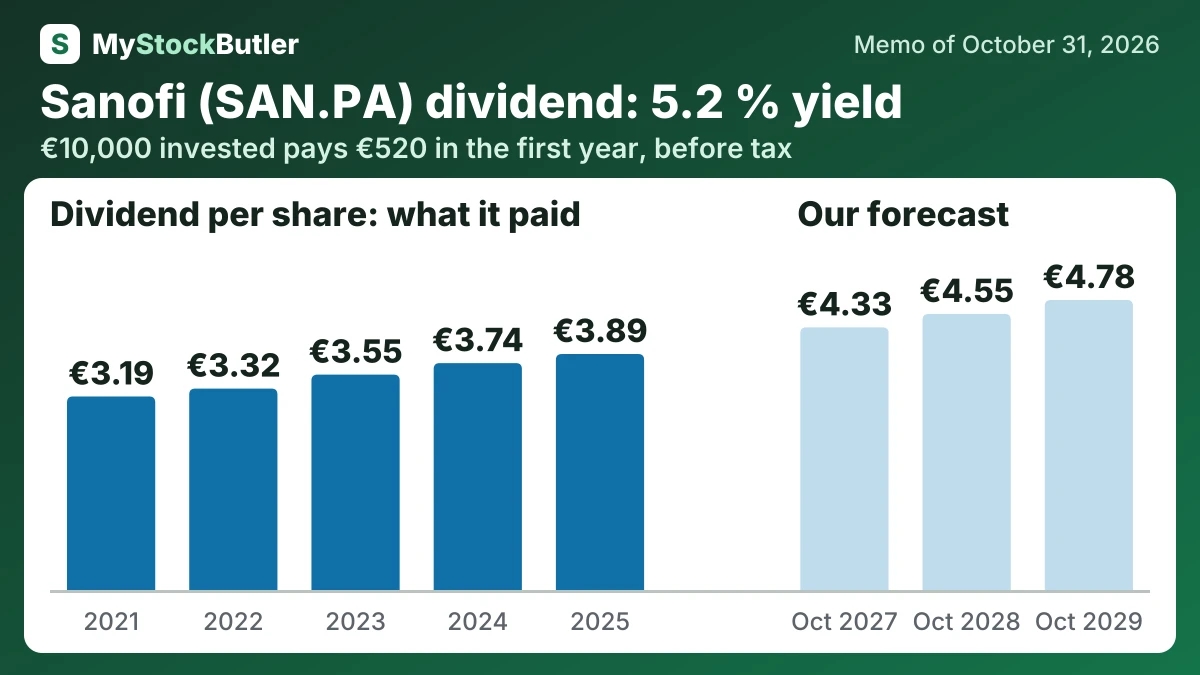
The base dividend rises from €4.33 in 2027 to €4.55 in 2028, then €4.78. This follows roughly 5% annual growth, close to the recent record and management’s progressive-dividend commitment. The bear case holds at €4.12 before cutting to €3.71. The bull case rises from €4.41 to €5.05 because stronger cash generation supports faster increases. Operating cash flow was €10.56 billion in 2025, but higher debt and competing investment limit certainty.
| October 2027 | October 2028 | October 2029 | |
|---|---|---|---|
| Earnings | 11,564 (9,940 / 12,241) | 12,407 (9,813 / 13,754) | 13,047 (9,571 / 15,339) |
| Shares (millions) | 1,192 (1,204 / 1,184) | 1,183 (1,207 / 1,169) | 1,174 (1,210 / 1,153) |
| Dividends per share | 4.33 (4.12 / 4.41) | 4.55 (4.12 / 4.72) | 4.78 (3.71 / 5.05) |
How much would Sanofi's dividend pay you?
€10,000 invested in Sanofi at its 5.2% dividend yield (our report of October 31, 2026) pays €520.00 in the first year, before tax. If its dividend per share keeps changing 5.1% a year, as it did from 2021 to 2025, and the dividends are reinvested, year 10 pays €1,418.96, with €8,881.57 received in all.
Before tax. Past dividend growth is not a promise. Information only, not investment advice.
Does Sanofi's cash cover its dividend?
After capital spending and lease payments, calculated free cash flow was €8.466 billion. Deducting €313 million of stock pay gives €8.153 billion, recognising that employees received something of value even though it was not a cash payment in the period. Sanofi’s own free-cash-flow measure was €8.089 billion because it uses a different reconciliation.
Shareholder payments were the most consistent destination. Dividends rose over the period, while buybacks surged in 2025. Together, dividends and buybacks exceeded that year’s free cash flow. Sanofi could cover the difference with cash already held, proceeds from selling Opella and new borrowing, but that makes future investment performance more important.
| 2025 | 2024 | 2023 | 2022 | 2021 | |
|---|---|---|---|---|---|
| Free cash flow | 8,466 | 6,592 | 7,399 | 7,829 | |
| − Dividends paid | 4,772 | 4,704 | 4,454 | 4,168 | 4,008 |
| − Share buybacks | 5,030 | 302 | 593 | 497 | 382 |
| = Free cash flow not paid out | 1,548 | 2,296 | 3,067 | ||
| = Paid out more than the free cash flow | 1,374 | ||||
| Paid out, % of free cash flow | 115.8% | 75.9% | 68.2% | 59.6% |
What this means. The company's net debt is higher than our count because it includes debt and cash hedging contracts, while our count leaves out those contracts and lease obligations.
What could change Sanofi's dividend?
The view would move toward the bear case during 2027–2029 if Dupixent patient growth or net pricing disappoints, or if launches fail to offset erosion. Weak cash conversion, higher debt and slower buybacks would add pressure.
What is Sanofi's dividend yield today?
| Today (Oct 31, 2026) | |
|---|---|
| Share price | 79.74 |
| P/E, last 12 months (calculated) | 23.0x |
| Free cash flow yield (calculated) | 8.8% |
| Dividend yield (calculated) | 5.2% |
What this means. The 8.7 price-to-earnings figure uses analysts’ guesses about next year’s profit, so it is not guaranteed.