Sanofi stock forecast 2027–2029
MyStockButler's October 2026 analysis: Sanofi's weighted scenario is €184.62 in October 2027 and €197.66 in October 2029. Sanofi's outcome hinges on replacing Dupixent before its concentration becomes a liability.
Where could Sanofi's shares be in each forecast year?
Our weighted price is €184.62 in October 2027, a 137% return including dividends. It reaches €197.66 in October 2029, a 165% return including dividends. Bear and base cases carry 25% and 60% probabilities. The bull case carries 15%.
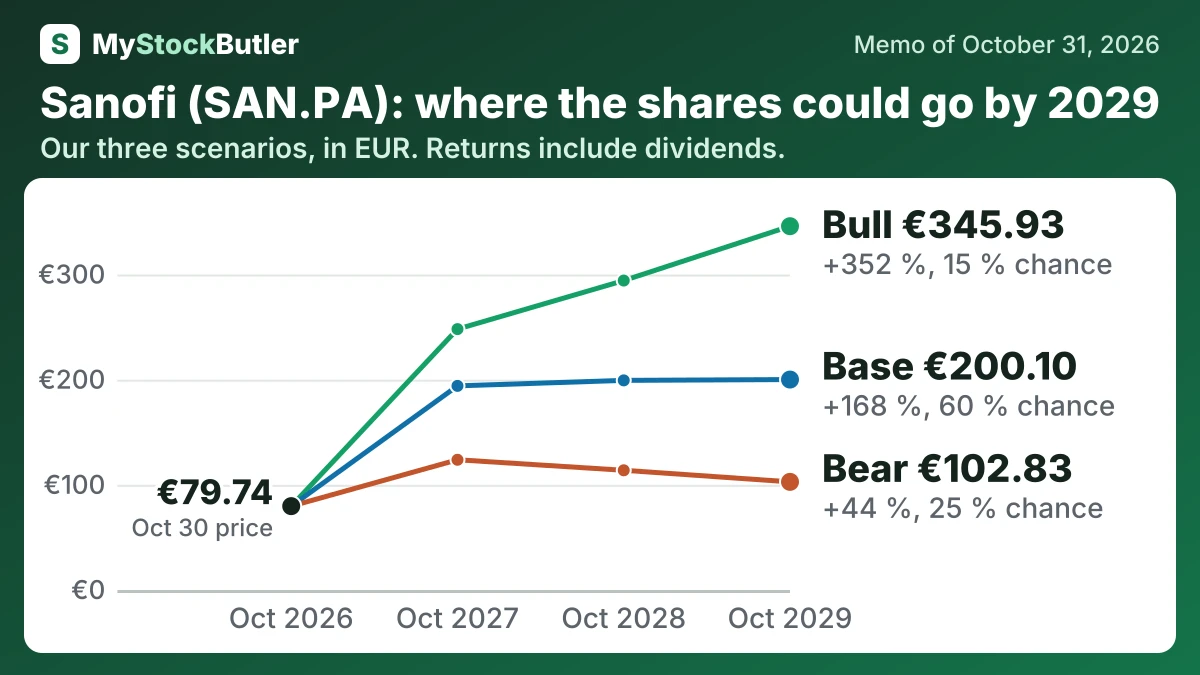
| Case | Probability | October 2027 | October 2028 | October 2029 |
|---|---|---|---|---|
| Bear | 25 % | 123.83 (+60 %) | 113.82 (+53 %) | 102.83 (+44 %) |
| Base | 60 % | 194.09 (+149 %) | 199.33 (+161 %) | 200.10 (+168 %) |
| Bull | 15 % | 248.07 (+217 %) | 294.24 (+280 %) | 345.93 (+352 %) |
| Weighted | 100 % | 184.62 (+137 %) | 192.19 (+152 %) | 197.66 (+165 %) |
What has to go right for Sanofi, and what could go wrong?
Earnings provide the main operating argument. The base case sets them at €11,564 million in October 2027 and €12,407 million in October 2028. They reach €13,047 million in October 2029. The path starts from €49.73 billion of 2026 revenue and assumes 8% growth in 2027. Growth then slows to 6% and 5%, while normalized margins move from 21.8% to 22.0%.
Strong Q3 trading, low-teens 2026 sales guidance and a €9.13 analyst next-twelve-month EPS estimate support the first step. The bear case falls from €9,940 million to €9,571 million by 2029 because Dupixent slows, pricing weakens and replacement products disappoint. The bull case rises from €12,241 million to €15,339 million as Dupixent, launches and pipeline outcomes support faster growth and margins.
How much cash does Sanofi really make?
After capital spending and lease payments, calculated free cash flow was €8.466 billion. Deducting €313 million of stock pay gives €8.153 billion, recognising that employees received something of value even though it was not a cash payment in the period. Sanofi’s own free-cash-flow measure was €8.089 billion because it uses a different reconciliation.
| 2025 | 2024 | 2023 | 2022 | |
|---|---|---|---|---|
| Cash from operations | 10,561 | 8,607 | 9,271 | 9,638 |
| = Free cash flow | 8,466 | 6,592 | 7,399 | 7,829 |
| − Stock pay | 313 | 278 | 260 | 234 |
| = Real free cash flow | 8,153 | 6,314 | 7,139 | 7,595 |
| Free cash flow, % of revenue | 19.4% | 16.0% | 19.6% | 20.8% |
| Real free cash flow, % of revenue | 18.7% | 15.4% | 18.9% | 20.2% |
What this means. The company's own free cash flow differs from ours because it uses different rules, adding back some cash items and subtracting others that our count handles differently.
What does an investor pay for Sanofi today?
At today’s share price, Sanofi is a profitable drug company whose apparent cheapness depends on which earnings and assets an investor counts. The real question is how durable those earnings will be after Dupixent faces competition.
| Today (Oct 31, 2026) | |
|---|---|
| Share price | 79.74 |
| P/E, last 12 months (calculated) | 23.0x |
| P/E, next 12 months (calculated) | 8.7x |
| Free cash flow yield (calculated) | 8.8% |
| Real free cash flow yield (calculated) | 8.5% |
| Dividend yield (calculated) | 5.2% |
What this means. The 8.7 price-to-earnings figure uses analysts’ guesses about next year’s profit, so it is not guaranteed.