Rogers stock forecast 2027–2029
MyStockButler's October 2026 analysis: Rogers’ weighted scenario is C$42.42 in October 2027, C$45.91 in October 2028 and C$51.98 in October 2029. It hinges on customer quality, debt reduction, reliable network investment and a timely sports-asset sale.
Where could Rogers’ shares be in each forecast year?
The weighted price is C$42.42 in October 2027, a 2% loss including dividends. It reaches C$45.91 in October 2028, a 10% gain. By October 2029, it reaches C$51.98, a 27% gain.
The last-date range is wide: C$15.94 in the bear case to C$95.55 in the bull case. Today’s price is C$45.36. The bear probability is 30%. The base probability is 53%. The bull probability is 17%.
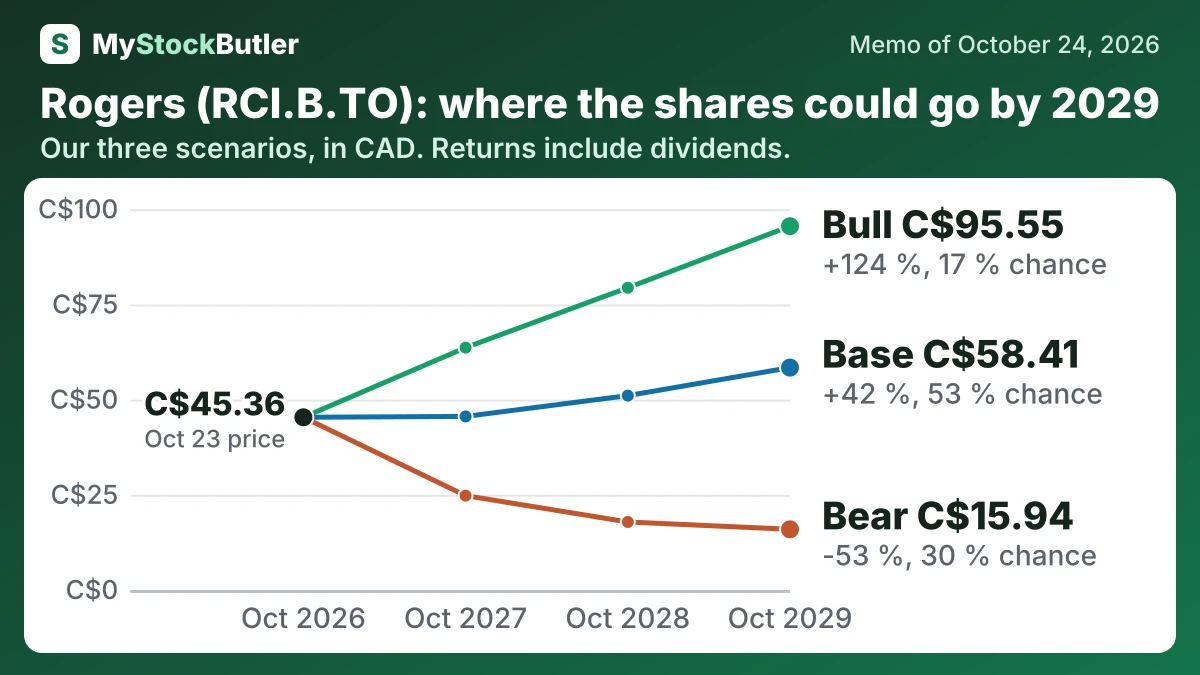
| Case | Probability | October 2027 | October 2028 | October 2029 |
|---|---|---|---|---|
| Bear | 30 % | 24.78 (-41 %) | 17.86 (-52 %) | 15.94 (-53 %) |
| Base | 53 % | 45.59 (+5 %) | 51.06 (+21 %) | 58.41 (+42 %) |
| Bull | 17 % | 63.66 (+45 %) | 79.39 (+84 %) | 95.55 (+124 %) |
| Weighted | 100 % | 42.42 (-2 %) | 45.91 (+10 %) | 51.98 (+27 %) |
What has to go right or wrong for Rogers?
EBITDA is the operating anchor, and the base case assumes only gradual expansion. Latest LTM adjusted EBITDA is C$10,030 million, following nine-month EBITDA of C$7,341 million. The base case reaches C$10,000 million in October 2027. It reaches C$10,150 million in 2028 and C$10,300 million in 2029. The bear case falls to C$9,700 million, then C$9,550 million, before recovering to C$9,600 million. The bull case reaches C$10,250 million, C$10,650 million and C$11,050 million. The base path reflects recent modest growth and reaffirmed 2026 EBITDA guidance of 1%–3%. The bear path reflects weak additions and lower ARPU, while the bull path assumes integration savings and stronger sports contributions.
| October 2027 | October 2028 | October 2029 | |
|---|---|---|---|
| EBITDA | 10,000 (9,700 / 10,250) | 10,150 (9,550 / 10,650) | 10,300 (9,600 / 11,050) |
| Shares (millions) | 541 (541 / 540) | 541 (542 / 541) | 542 (543 / 541) |
| Dividends per share | 2.00 (2.00 / 2.00) | 2.00 (2.00 / 2.00) | 2.00 (1.50 / 2.00) |
| Enterprise value to ebitda | 6.40 (5.80 / 7.00) | 6.40 (5.30 / 7.30) | 6.50 (5.00 / 7.60) |
| Net debt | 39,349 (42,849 / 37,349) | 37,329 (40,929 / 34,829) | 35,309 (39,339 / 32,309) |
How much cash does Rogers really make?
Cash from operations was C$6.059 billion in 2025. Rogers deducted C$3.707 billion of capital spending and C$559 million of lease principal, leaving C$1.793 billion. Removing C$98 million of share-based compensation leaves an analytical “real free cash flow” figure of C$1.695 billion.
| 2025 | 2024 | 2023 | 2022 | 2021 | |
|---|---|---|---|---|---|
| Cash from operations | 6,059 | 5,680 | 5,221 | 4,493 | 4,161 |
| − Capital spending | 3,707 | 4,041 | 3,934 | 3,075 | 2,788 |
| − Lease payments | 559 | 478 | 370 | 316 | 269 |
| = Free cash flow | 1,793 | 1,161 | 917 | 1,102 | 1,104 |
| − Stock pay | 98 | 54 | 65 | 67 | 60 |
| = Real free cash flow | 1,695 | 1,107 | 852 | 1,035 | 1,044 |
What does an investor pay today for Rogers?
P/E means the price paid for one dollar of earnings. Rogers’ trailing and forward ratios imply very different earnings because reported profit includes acquisition accounting and MLSE revaluations, while adjusted earnings remove items such as extra Shaw-related depreciation.