Rogers dividend: payout, cash flow and yield
MyStockButler's October 2026 analysis: Rogers pays C$2.00 a year per share, and its annual dividend stayed at C$2.00 from 2021 through 2025. Rogers' analytical cash residual was C$1.695 billion in 2025, while cash dividends were C$913 million, leaving approximately C$649 million before other investing uses and acquisitions.
How much does Rogers pay per share?
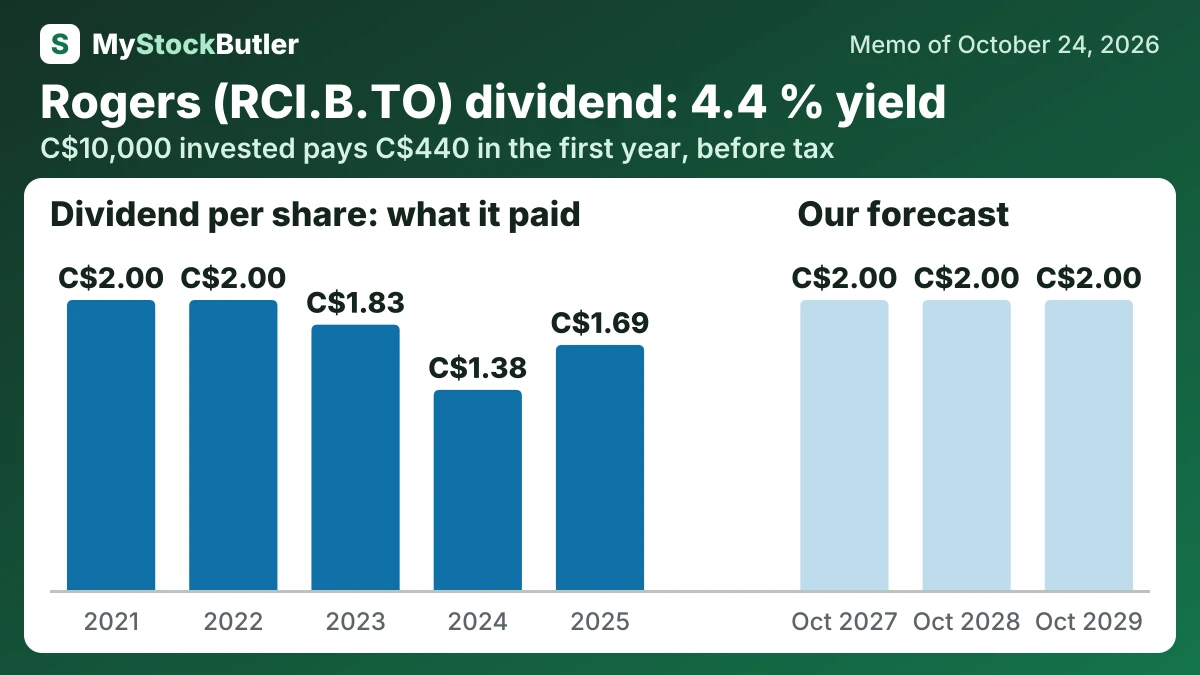
The dividend remains a cash-return support rather than a growth assumption. The base case holds it at C$2.00 in each year. The bull case does the same. The bear case holds C$2.00 through 2028 but cuts it to C$1.50 in 2029. The latest declaration was C$0.50 per share, and the annual dividend stayed at C$2.00 from 2021 through 2025. The cut reflects refinancing risk after the MLSE borrowing.
| 2025 | 2024 | 2023 | 2022 | 2021 | |
|---|---|---|---|---|---|
| EPS, diluted | 12.74 | 3.20 | 1.62 | 3.32 | 3.07 |
| Real free cash flow per share | 3.13 | 2.07 | 1.63 | 2.05 | 2.06 |
| Free cash flow per share | 3.31 | 2.17 | 1.75 | 2.18 | 2.18 |
| − Dividends paid, per share | 1.69 | 1.38 | 1.83 | 2.00 | 2.00 |
| = FCF not paid out, per share | 1.38 | 0.79 | 0.18 | 0.19 |
What this means. The company's own free cash flow per share is higher because it uses a different calculation from ours, so the two figures are not directly comparable.
How much would Rogers's dividend pay you?
C$10,000 invested in Rogers at its 4.4% dividend yield (our report of October 24, 2026) pays C$440.00 in the first year, before tax. If its dividend per share keeps changing −4.1% a year, as it did from 2021 to 2025, and the dividends are reinvested, year 10 pays C$419.15, with C$4,334.26 received in all.
Before tax. Past dividend growth is not a promise. Information only, not investment advice.
Does Rogers' dividend have cash coverage?
Cash from operations was C$6.059 billion in 2025. Rogers deducted C$3.707 billion of capital spending and C$559 million of lease principal, leaving C$1.793 billion. Removing C$98 million of share-based compensation leaves an analytical “real free cash flow” figure of C$1.695 billion.
Its analytical cash residual was C$1.695 billion in 2025. Minority distributions were C$133 million and cash dividends were C$913 million. That left approximately C$649 million before other investing uses and acquisitions. The calculation shows why operating scale and debt-repayment capacity are different things.
| 2025 | 2024 | 2023 | 2022 | 2021 | |
|---|---|---|---|---|---|
| Free cash flow | 1,793 | 1,161 | 917 | 1,102 | 1,104 |
| − Paid to minority owners | 133 | 0 | 0 | 0 | 0 |
| − Dividends paid | 913 | 739 | 960 | 1,010 | 1,010 |
| − Share buybacks | 0 | 0 | 0 | 0 | 0 |
| = Free cash flow not paid out | 747 | 422 | 92 | 94 | |
| Paid out, % of free cash flow | 50.9% | 63.7% | 104.7% | 91.7% | 91.5% |
What this means. The company's own net debt is different because it adjusts the debt for leases, financial contracts, and some subordinated debt, while our count simply subtracts cash from total borrowings.
What could change Rogers' dividend?
The September 2027 maturity is the hard deadline. Refinancing itself does not reduce debt, so the outcome depends on sale proceeds and retained cash flow.
| October 2027 | October 2028 | October 2029 | |
|---|---|---|---|
| EBITDA | 10,000 (9,700 / 10,250) | 10,150 (9,550 / 10,650) | 10,300 (9,600 / 11,050) |
| Shares (millions) | 541 (541 / 540) | 541 (542 / 541) | 542 (543 / 541) |
| Dividends per share | 2.00 (2.00 / 2.00) | 2.00 (2.00 / 2.00) | 2.00 (1.50 / 2.00) |
| Enterprise value to ebitda | 6.40 (5.80 / 7.00) | 6.40 (5.30 / 7.30) | 6.50 (5.00 / 7.60) |
| Net debt | 39,349 (42,849 / 37,349) | 37,329 (40,929 / 34,829) | 35,309 (39,339 / 32,309) |
What is Rogers' dividend yield against its share price?
The last-date range is wide: C$15.94 in the bear case to C$95.55 in the bull case. Today’s price is C$45.36. The bear probability is 30%. The base probability is 53%. The bull probability is 17%.