PPL dividend: payment and cash coverage
MyStockButler's October 2026 analysis: PPL pays $1.14 per share annually, based on its current annualized rate. Its 2025 operating cash of $2,629 million did not cover $4,030 million of capital spending, leaving free cash flow negative $1,401 million.
How much does PPL pay per share?
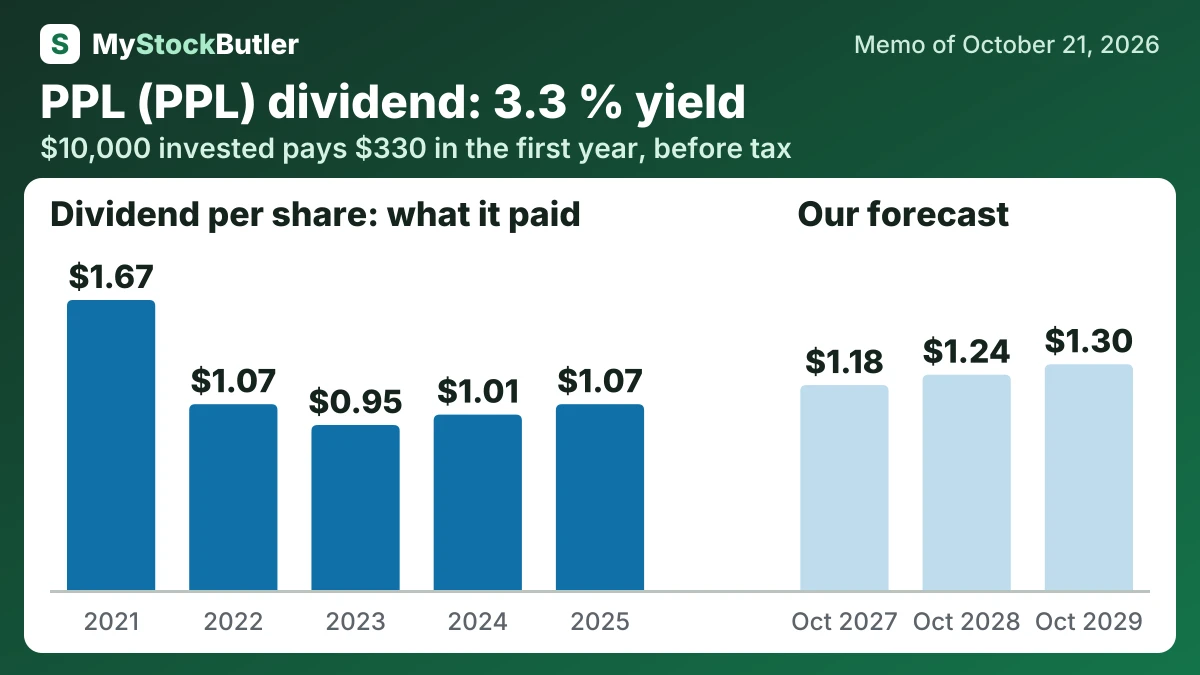
Dividends start from the current annualized $1.14 rate after the quarterly payment increased to $0.285. The base row reaches $1.18 per share in 2027 and $1.30 in 2029, using 5% annual growth, the midpoint of management’s 4%–6% target. The bear case holds the dividend at $1.14 because capital spending exceeded operating cash by $1,401 million in 2025. The bull case reaches $1.19 and $1.34 as recovery and earnings support the top end of dividend guidance.
| 2025 | 2024 | 2023 | 2022 | 2021 | |
|---|---|---|---|---|---|
| EPS, diluted | 1.59 | 1.20 | 1.00 | 0.96 | 0.03 |
| Free cash flow per share | -1.88 | -0.63 | -0.86 | -0.58 | -0.56 |
| − Dividends paid, per share | 1.07 | 1.01 | 0.95 | 1.07 | 1.67 |
| − Share buybacks, per share | 0.00 | 0.00 | 0.00 | 0.00 | 1.31 |
What this means. Real free cash flow per share is lower because we subtract the value of shares given to employees as pay.
How much would PPL's dividend pay you?
$10,000 invested in PPL at its 3.3% dividend yield (our report of October 21, 2026) pays $330.00 in the first year, before tax. If its dividend per share keeps changing −10.5% a year, as it did from 2021 to 2025, and the dividends are reinvested, year 10 pays $147.44, with $2,311.79 received in all.
Before tax. Past dividend growth is not a promise. Information only, not investment advice.
Is PPL's dividend covered by its cash?
PPL generated $2,629 million of operating cash in 2025 and spent $4,030 million on property and equipment. Free cash flow was therefore negative $1,401 million. Operating cash rose, but capital spending rose faster, so the worsening cash position reflects investment rather than a collapse in collections.
| 2025 | 2024 | 2023 | 2022 | 2021 | |
|---|---|---|---|---|---|
| Free cash flow | -1,401 | -465 | -632 | -425 | -429 |
| − Dividends paid | 794 | 747 | 704 | 787 | 1,279 |
| − Share buybacks | 0 | 0 | 0 | 0 | 1,003 |
| = Paid out more than the free cash flow | 2,195 | 1,212 | 1,339 | 1,212 | 2,711 |
| Paid out, % of free cash flow | not meaningful | not meaningful | not meaningful | not meaningful | not meaningful |
What this means. The company paid dividends even though it generated negative free cash flow, so it had to use cash savings or borrow more money to pay shareholders.
What could change PPL's dividend?
PPL later resumed heavy external financing. Its 2026–2029 investment plan calls for $23 billion of spending and about $3 billion of equity financing. About $1 billion had been arranged by February 2026, and about $2 billion by May. Management retained targets of 6%–8% annual earnings-per-share growth and 4%–6% dividend growth. New shares dilute existing owners, so the programme succeeds only if approved investment grows earnings per share after financing.
| October 2027 | October 2028 | October 2029 | |
|---|---|---|---|
| Earnings | 1,557 (1,513 / 1,586) | 1,666 (1,573 / 1,729) | 1,783 (1,636 / 1,885) |
| Shares (millions) | 782 (790 / 779) | 805 (820 / 798) | 837 (855 / 825) |
| Dividends per share | 1.18 (1.14 / 1.19) | 1.24 (1.14 / 1.26) | 1.30 (1.14 / 1.34) |
| Price to earnings | 16.30 (14.50 / 18.00) | 16.50 (13.50 / 19.00) | 16.50 (12.50 / 20.00) |