PPL stock forecast 2027–2029
MyStockButler's October 2026 analysis: PPL's weighted forecast reaches $34.34 in October 2029, a 10% gain. It hinges on recovery delays, financing costs, dilution and whether large customers energize sooner.
Where could PPL's shares be by 2029?
Probability weighting leaves PPL at $32.07 in October 2027, a 4% loss including dividends. It reaches $33.41 in October 2028, a 4% gain. By October 2029, it reaches $34.34, a 10% gain. The bear-to-bull span at that final date is $23.92 to $45.70. Today’s price is $34.58.
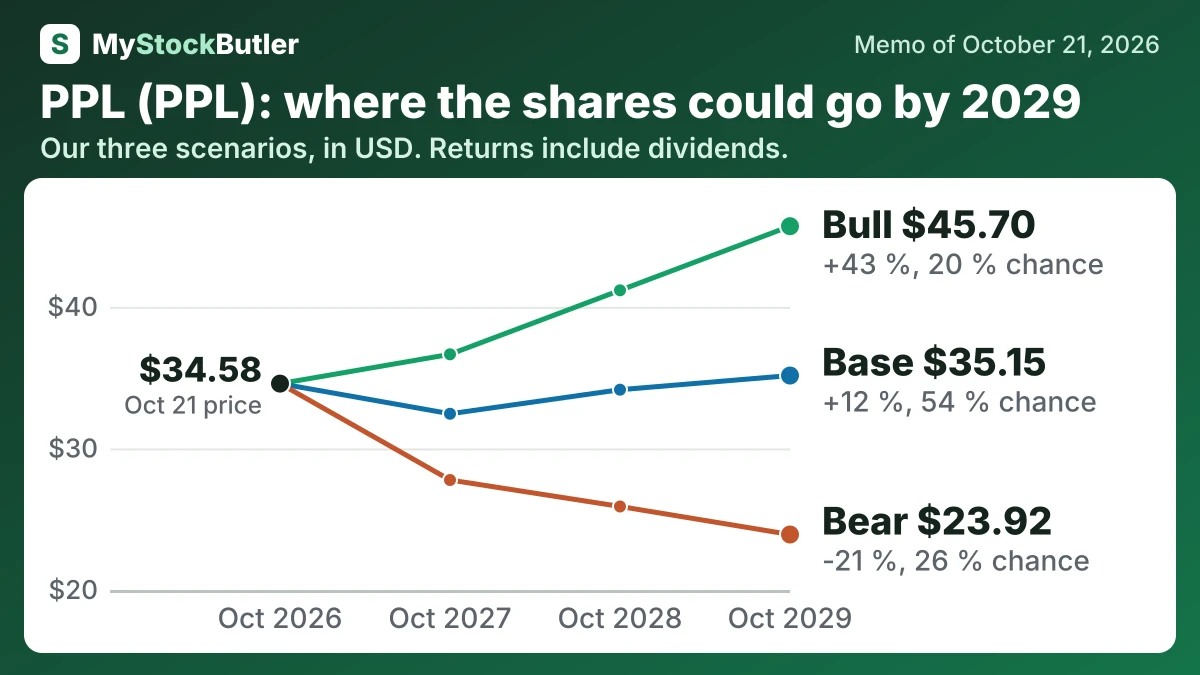
| Case | Probability | October 2027 | October 2028 | October 2029 |
|---|---|---|---|---|
| Bear | 26 % | 27.77 (-16 %) | 25.90 (-19 %) | 23.92 (-21 %) |
| Base | 54 % | 32.45 (-3 %) | 34.15 (+6 %) | 35.15 (+12 %) |
| Bull | 20 % | 36.65 (+9 %) | 41.17 (+26 %) | 45.70 (+43 %) |
| Weighted | 100 % | 32.07 (-4 %) | 33.41 (+4 %) | 34.34 (+10 %) |
What has to go right or wrong for PPL by 2029?
That rate is the midpoint of management’s 6%–8% target. It is supported by steadily rising adjusted earnings and a planned $22,975 million utility investment programme. The bear case uses 4% growth, reaching $1,513 million in 2027 and $1,636 million in 2029, because recovery delays, financing costs and dilution could absorb rate-base growth. The bull case uses 9% growth, reaching $1,586 million and $1,885 million, because large customers could energize sooner and recovery could be timely. The forecast excludes prospective Invitium earnings.
How much cash does PPL really make?
PPL generated $2,629 million of operating cash in 2025 and spent $4,030 million on property and equipment. Free cash flow was therefore negative $1,401 million. Operating cash rose, but capital spending rose faster, so the worsening cash position reflects investment rather than a collapse in collections.
| 2025 | 2024 | 2023 | 2022 | 2021 | |
|---|---|---|---|---|---|
| Cash from operations | 2,629 | 2,340 | 1,758 | 1,730 | 1,544 |
| − Capital spending | 4,030 | 2,805 | 2,390 | 2,155 | 1,973 |
| = Free cash flow | -1,401 | -465 | -632 | -425 | -429 |
| − Stock pay | 49 | 46 | 33 | 37 | 37 |
| = Real free cash flow | -1,450 | -511 | -665 | -462 | -466 |
What this means. The business brings in cash from daily operations, but spends more on equipment and employee shares, so it has no cash left for shareholders.
What does an investor pay for PPL today?
The price-to-earnings ratio, or P/E, says how many dollars investors pay for each dollar of earnings. A trailing P/E uses the last twelve months; a forward P/E uses forecast earnings. The forward figure implies roughly $2.12 of forecast earnings per share, above management’s 2026 guidance. That gap means the valuation depends on a step-up that has not yet become reported profit.
| Today (Oct 21, 2026) | |
|---|---|
| Share price | 34.575 |
| P/E, last 12 months (calculated) | 20.5x |
| P/E, next 12 months (calculated) | 16.3x |
| Free cash flow yield (calculated) | -5.4% |
| Real free cash flow yield (calculated) | -5.6% |