FirstEnergy stock forecast 2027–2029
MyStockButler's October 2026 analysis: FirstEnergy's weighted price is $41.53 at October 2027. The outcome hinges on approved investment becoming earnings without excessive financing pressure.
Where could FirstEnergy's shares be by 2029?
The 2029 range runs from $29.80 in the bear case to $75.99 in the bull case. Today's reference price is $46.28. The base case has the highest probability at 55%, against 27% for bear and 18% for bull.
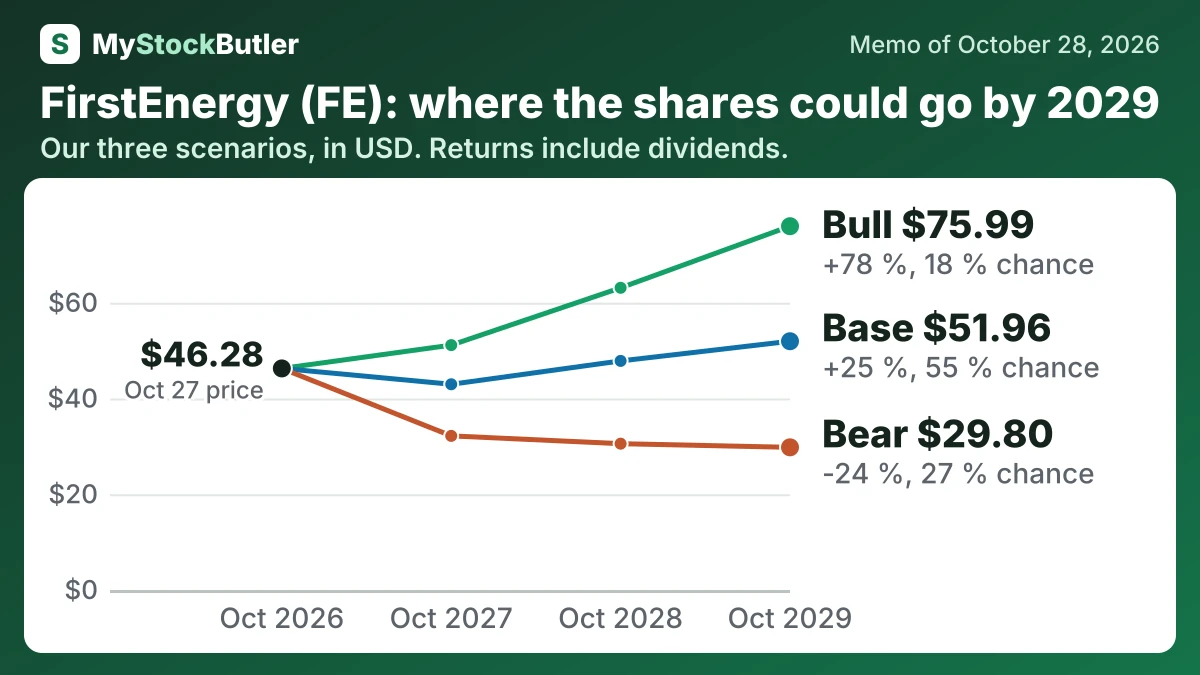
| Case | Probability | October 2027 | October 2028 | October 2029 |
|---|---|---|---|---|
| Bear | 27 % | 32.19 (-26 %) | 30.56 (-26 %) | 29.80 (-24 %) |
| Base | 55 % | 42.97 (-3 %) | 47.85 (+12 %) | 51.96 (+25 %) |
| Bull | 18 % | 51.15 (+15 %) | 63.12 (+45 %) | 75.99 (+78 %) |
| Weighted | 100 % | 41.53 (-6 %) | 45.93 (+8 %) | 50.30 (+22 %) |
What has to go right or wrong for FirstEnergy's forecast?
The bear case requires several risks to compound. Ohio disallowances and litigation weaken earnings confidence, while construction spending funded with debt and equity increases dilution. Delayed large-load or transmission projects then leave assets earning less than planned. The share price falls from $32.19 in October 2027 to $29.80 in October 2029, with a 27% probability. The probability is material because FirstEnergy has negative free cash flow, substantial funding needs and documented regulatory disallowances.
The bull case requires connected large customers, approved transmission projects and timely formula-rate recovery. Stronger cash generation contains dilution, while clearer earnings conversion lifts the P/E multiple. The share price rises from $51.15 to $75.99, with an 18% probability. The path is less likely because contracted demand is not yet connected revenue and each project still depends on approval, construction and recovery.
How much cash does FirstEnergy really make?
Operating cash did not cover capital spending, leaving free cash flow negative. Free cash flow subtracts spending on poles, wires, substations and other long-lived assets from cash generated by operations. Stock compensation is not a cash payment when issued, but it can dilute shareholders, so a stricter measure deducts it as an economic cost.
| 2025 | 2024 | 2023 | 2022 | 2021 | |
|---|---|---|---|---|---|
| Cash from operations | 3,700 | 2,891 | 1,387 | 2,683 | 2,811 |
| − Capital spending | 4,705 | 4,030 | 3,356 | 2,848 | 2,487 |
| = Free cash flow | -1,005 | -1,139 | -1,969 | -165 | 324 |
| − Stock pay | 39 | 43 | 44 | 54 | 43 |
| = Real free cash flow | -1,044 | -1,182 | -2,013 | -219 | 281 |
What this means. Stock pay is subtracted even though it uses no cash because giving employees shares gives away part of the company to them.
What does an investor pay for FirstEnergy today?
The price-to-earnings ratio, or P/E, divides the share price by earnings per share. The trailing P/E uses the last twelve months; the forward P/E uses an estimate for the next twelve. The lower forward multiple therefore assumes that earnings will improve, not that the share price will fall.
| Today (Oct 28, 2026) | |
|---|---|
| Share price | 46.28 |
| Market value (calculated) | 26,779.456053 |
| Enterprise value (calculated) | 55,699.456053 |
| P/E, last 12 months (calculated) | 22.4x |
| P/E, next 12 months (calculated) | 15.7x |
| Free cash flow yield (calculated) | -3.8% |
What this means. The company pays a 4.0% dividend even though its latest free cash flow was negative, meaning it paid shareholders more cash than it generated after spending on its business.