Nebius earnings: date, guidance and watchpoints
MyStockButler's October 2026 analysis: Nebius expects its next results on November 10, 2026. Watch whether connected power becomes customer-ready capacity and begins producing billable service.
What has Nebius guided for 2026?
Management guides to $3.0–$3.4 billion of revenue and $7–$9 billion of ARR in 2026. ARR means annualized run-rate revenue, calculated as the latest month’s Nebius AI Cloud revenue multiplied by twelve. It also guides to 800–1,000 MW of connected power, a 40% adjusted EBITDA margin for Nebius AI Cloud and 5 GW of contracted power by year-end 2026.
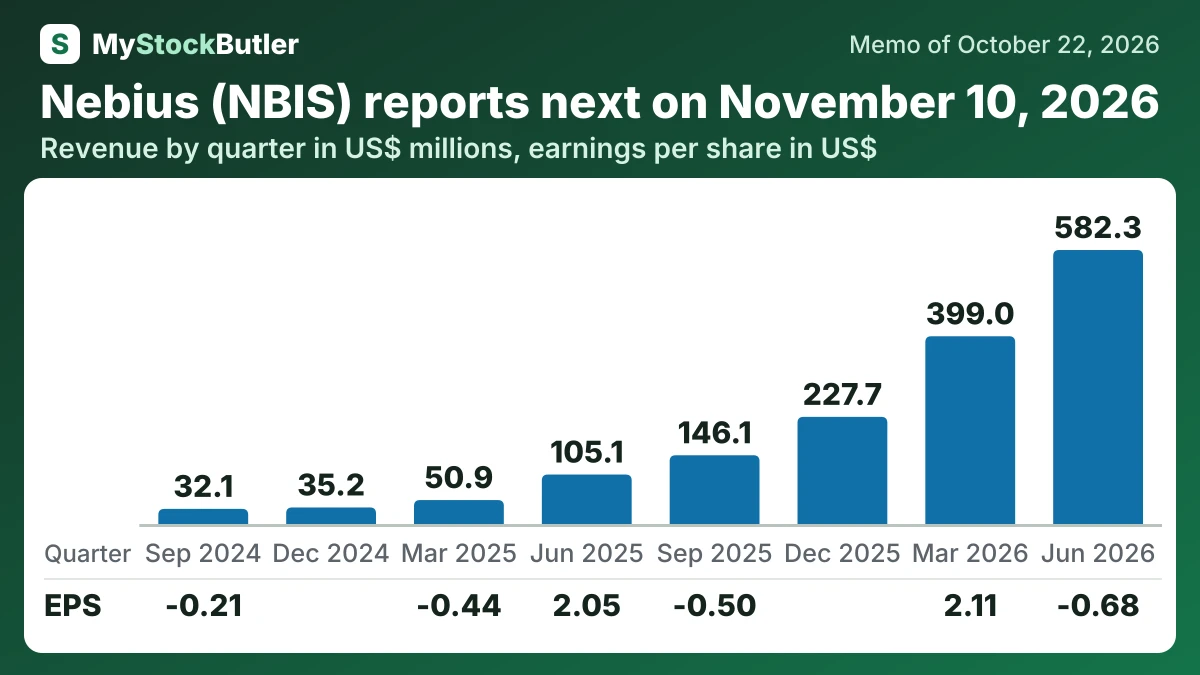
Nebius (NBIS): Revenue by quarter (US$ millions): Sep 2024 32.1, Dec 2024 35.2, Mar 2025 50.9, Jun 2025 105.1, Sep 2025 146.1, Dec 2025 227.7, Mar 2026 399.0, Jun 2026 582.3; EPS -$0.21, -$0.44, $2.05, -$0.50, $2.11, -$0.68
| Period guided | Low | High | Date given | |
|---|---|---|---|---|
| Revenue | Year to Dec 2026 | 3.0 | 3.4 | Aug 12, 2026 |
| Annualized run-rate revenue (ARR) | Year to Dec 2026 | 7 | 9 | Aug 12, 2026 |
| Nebius AI cloud adjusted EBITDA margin (%) | Year to Dec 2026 | 40.0% | 40.0% | Aug 12, 2026 |
| Contracted power (GW) | Year to Dec 2026 | 5 | 5 | Aug 12, 2026 |
| Connected power (MW) | Year to Dec 2026 | 800 | 1,000 | Aug 12, 2026 |
What this means. Annualized run-rate revenue is not the year's actual sales; it multiplies one month's December sales by twelve to estimate a yearly pace.
Has Nebius kept its past promises?
Nebius has nevertheless delivered important operating promises. In February 2025, Volozh reaffirmed a December annualized run-rate target of $750 million to $1 billion. Nebius finished 2025 at $1.25 billion. By August 2026, it had also delivered all Microsoft capacity tranches due by then. Annualized run-rate revenue shows the pace of a period, not guaranteed future revenue, profit or cash.
How have Nebius's revenue and profit changed?
Revenue continued to accelerate, supported by capacity added earlier, better utilization, newer services and acquisitions. The eight-quarter record shows repeated expansion rather than one isolated surge. Gross margin and operating margin improved because revenue grew faster than operating expenses.
| Jun 2026 | Mar 2026 | Dec 2025 | Sep 2025 | Jun 2025 | Mar 2025 | Dec 2024 | Sep 2024 | |
|---|---|---|---|---|---|---|---|---|
| Revenue | 582.3 | 399.0 | 227.7 | 146.1 | 105.1 | 50.9 | 35.2 | 32.1 |
| Gross margin | 77.1% | 74.0% | 69.9% | 70.6% | 71.4% | 51.5% | 40.1% | 69.2% |
| Operating income | -175.9 | -128.0 | -234.5 | -130.2 | -111.2 | -120.3 | -136.5 | -80.6 |
| Net income | -190.4 | 621.2 | -249.6 | -119.6 | 502.5 | -104.3 | -122.9 | -43.6 |
What this means. A positive net income number does not mean the main business made money, because it can include gains and other items outside daily operations.
What should I watch in Nebius's next results?
Through December 31, 2026, investors should compare actual service starts and collections with the guidance. A strong exit ARR without a clear account of active capacity would leave questions about durability. Large advances without matching delivery would instead show a growing service obligation.
Spot pricing offers a nearer commercial test. Nebius now sells interruptible GPU capacity at live prices, alongside short reserve auctions and pay-as-you-go access. A listed H100 spot price was $0.67 per GPU-hour on October 22, 2026. Spot sales can monetize idle machines, but falling prices or weak occupancy would signal weaker scarcity.