Nebius stock forecast 2027–2029
MyStockButler's October 2026 analysis: The weighted scenario reaches $536.43 in October 2029 at 45% base, with 40% bear and 15% bull. It hinges on turning power commitments into paid, cash-generating GPU capacity.
Where could Nebius’s shares be by October 2029?
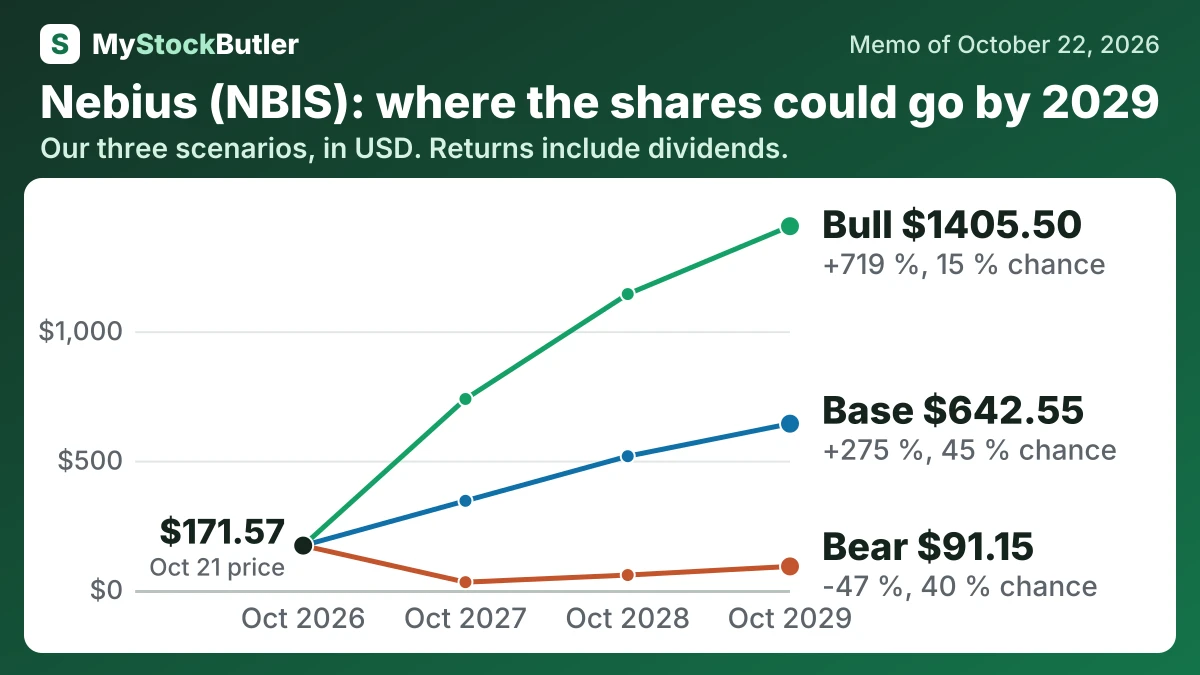
The weighted forecast reaches $277.86 in October 2027, a 62% return, and $536.43 in October 2029. It assigns 40% to the bear case, 45% to the base case and 15% to the bull case. The October 2029 range is $91.15 to $1,405.50. Bear, base and bull EBITDA assumptions are $3.5 billion, $8.5 billion and $12.5 billion.
| Case | Probability | October 2027 | October 2028 | October 2029 |
|---|---|---|---|---|
| Bear | 40 % | 30.29 (-82 %) | 57.80 (-66 %) | 91.15 (-47 %) |
| Base | 45 % | 344.54 (+101 %) | 516.92 (+201 %) | 642.55 (+275 %) |
| Bull | 15 % | 737.99 (+330 %) | 1143.28 (+566 %) | 1405.50 (+719 %) |
| Weighted | 100 % | 277.86 (+62 %) | 427.22 (+149 %) | 536.43 (+213 %) |
What this means. The weighted value is an average of the three cases based on their probabilities, not a prediction that the shares will reach that exact price.
What has to go right for Nebius’s forecast, and what could go wrong?
The bear case gives $0.9B, $2.0B and $3.5B across the three dates. It assumes delayed commissioning, weaker utilization and margins below plan. The bull case gives $4.8B, $8.5B and $12.5B, requiring timely sites, strong pricing and margins above the initial target.
| October 2027 | October 2028 | October 2029 | |
|---|---|---|---|
| EBITDA | 3,100 (900 / 4,800) | 5,600 (2,000 / 8,500) | 8,500 (3,500 / 12,500) |
| Shares (millions) | 303 (310 / 290) | 319 (336 / 299) | 336 (363 / 319) |
| Dividends per share | 0.00 (0.00 / 0.00) | 0.00 (0.00 / 0.00) | 0.00 (0.00 / 0.00) |
| Enterprise value to ebitda | 35.00 (22.00 / 45.00) | 30.00 (18.00 / 40.00) | 25.00 (15.00 / 35.00) |
| Net debt | 4,104 (10,404 / 2,204) | 3,104 (16,604 / -1,496) | -3,396 (19,404 / -10,996) |
What this means. In the 2029 optimistic case, negative net debt means the company would have more cash than borrowed money.
How much cash does Nebius really make?
Capital spending then absorbed the operating inflow. Nebius bought GPUs, buildings and networking on a scale far beyond current operating cash, leaving free cash flow deeply negative. Adding stock compensation to the analysis makes the owner’s economic shortfall larger, because employees receive part of the business even though no cash leaves at that moment.
| 2025 | 2024 | 2023 | 2022 | |
|---|---|---|---|---|
| Cash from operations | 401.9 | -269.9 | -222.0 | |
| − Capital spending | 4,066.0 | 807.5 | 82.9 | 14.6 |
| = Free cash flow | -3,664.1 | -1,077.4 | -304.9 | |
| − Stock pay | 83.2 | 54.5 | 28.8 | |
| = Real free cash flow | -3,747.3 | -1,131.9 | -333.7 | |
| Real free cash flow, % of revenue | -707.3% | -1,237.0% | -3,405.1% |
What this means. The company spent far more on equipment and buildings than its daily business brought in, so its free cash flow is deeply negative.
What does an investor pay today for Nebius?
At US$171.57 a share on October 22, 2026, Nebius is priced for a much larger cash-producing business than the one operating today.
Customer prepayments reduce the need for outside financing, but they are not profit. In Q2 2026, roughly 70% of deals included prepayments covering 50–60% of associated capital expenditure. Like a builder receiving money before completing an extension, Nebius can use the cash to build capacity but must still deliver the service. Its −7.9% free cash flow yield shows that current cash generation does not support the valuation by itself.