Mosaic stock forecast 2027–2029
MyStockButler's October 2026 analysis: Mosaic's weighted scenario is $43.00 in October 2029, with 50% assigned to the base case. It hinges on sulfur supply, plant utilization, Brazilian collections and cash generation recovering.
Where could Mosaic's shares be by 2029?
The forecast assigns 35% to the bear case, 50% to the base case and 15% to the bull case. Weighted value is $15.59 in October 2027, a 9% loss including dividends, and $43.00 in October 2029, a 152% gain including dividends.
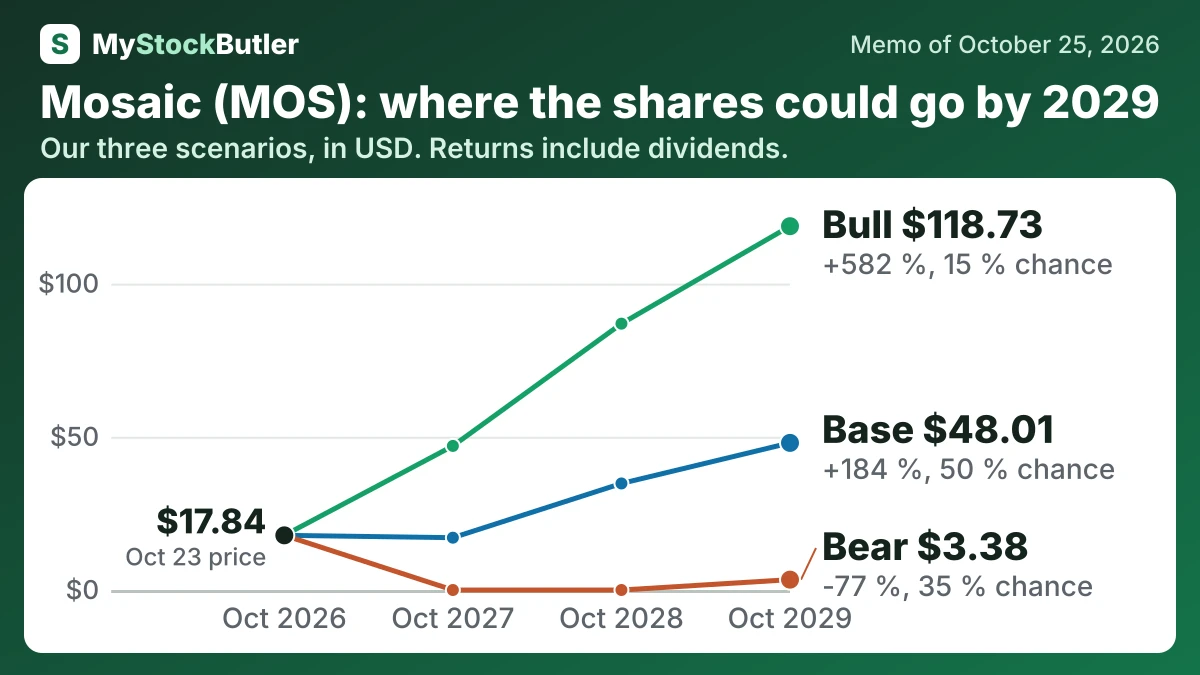
| Case | Probability | October 2027 | October 2028 | October 2029 |
|---|---|---|---|---|
| Bear | 35 % | 0.00 (-98 %) | 0.00 (-96 %) | 3.38 (-77 %) |
| Base | 50 % | 17.07 (+1 %) | 34.77 (+105 %) | 48.01 (+184 %) |
| Bull | 15 % | 47.02 (+169 %) | 86.92 (+398 %) | 118.73 (+582 %) |
| Weighted | 100 % | 15.59 (-9 %) | 30.42 (+78 %) | 43.00 (+152 %) |
What this means. The weighted row is a probability-based average, not a prediction that the share price will actually be that exact amount.
What has to go right for Mosaic?
Operating profit follows a staged recovery rather than a return to peak conditions. The base case uses $1,100 million in October 2027 and $1,500 million in October 2028. It reaches $1,700 million in 2029. The bear case gives $400 million first and $650 million next, ending at $850 million. The bull case starts at $1,800 million, reaches $2,400 million, and ends at $2,800 million. The choices reflect the recent operating loss, negative phosphate margins, withdrawn phosphate guidance and the historical cycle, while allowing cost reductions and sulfur normalization to help.
| October 2027 | October 2028 | October 2029 | |
|---|---|---|---|
| Normal operating profit | 1,100 (400 / 1,800) | 1,500 (650 / 2,400) | 1,700 (850 / 2,800) |
| Shares (millions) | 318 (318 / 318) | 319 (319 / 314) | 319 (320 / 307) |
| Dividends per share | 0.88 (0.44 / 0.88) | 0.88 (0.22 / 1.00) | 0.96 (0.00 / 1.12) |
| Enterprise value to normal operating profit | 10.00 (9.00 / 11.00) | 11.00 (9.50 / 13.00) | 12.00 (10.00 / 14.00) |
| Net debt | 5,565 (6,465 / 4,828) | 5,411 (7,071 / 3,871) | 5,067 (7,419 / 2,726) |
How much cash does Mosaic really make?
In 2025, operating cash failed to cover capital spending, leaving free cash flow negative. The main operating drag was working capital: Mosaic bought and held more finished product, rock and sulfur before collecting cash from customers. Inventory may later release cash, but a weak market can force the company to sell it at a poor margin.
| 2025 | 2024 | 2023 | 2022 | 2021 | |
|---|---|---|---|---|---|
| Cash from operations | 824.8 | 1,299.2 | 2,407.2 | 3,935.8 | 2,187.0 |
| − Capital spending | 1,359.4 | 1,251.8 | 1,402.4 | 1,247.3 | 1,288.6 |
| = Free cash flow | -534.6 | 47.4 | 1,004.8 | 2,688.5 | 898.4 |
| − Stock pay | 30.7 | 31.8 | 33.0 | 27.9 | 29.5 |
| = Real free cash flow | -565.3 | 15.6 | 971.8 | 2,660.6 | 868.9 |
| Real free cash flow, % of revenue | -4.7% | 0.1% | 7.1% | 13.9% | 7.0% |
What this means. The company's own free cash flow is lower than ours in 2023 and 2022 because it also subtracts money used to finance working capital, while our count leaves that in.
What does an investor pay for Mosaic today?
The forward P/E is 12.6x, meaning investors are paying for earnings expected over the next twelve months. Trailing P/E is not meaningful, so the apparent affordability depends on a forecast. For a cyclical fertilizer producer, normalized earnings matter more than a single strong or weak year. They reflect sustainable fertilizer prices, input costs and operating rates.